

Question: 1.Perform the Two-Sample Test for Mean with paired samples for the following: Driving distance and Average Score 2. Perform the One-Way Anova test for all
1.Perform the Two-Sample Test for Mean with paired samples for the following: Driving distance and Average Score
2. Perform the One-Way Anova test for all the attributes (variables).
3. Perform the correlation analysis for Golfing Statistics data.
4. Considering Earnings/Event as the dependent variable (outcome), perform the multiple linear regression using Excel with normal probability plot showing the linear trendlines. Explain the R2, F-stat (Anova) and the regression coefficients.
5 Write down the linear equation for Earnings/Event.
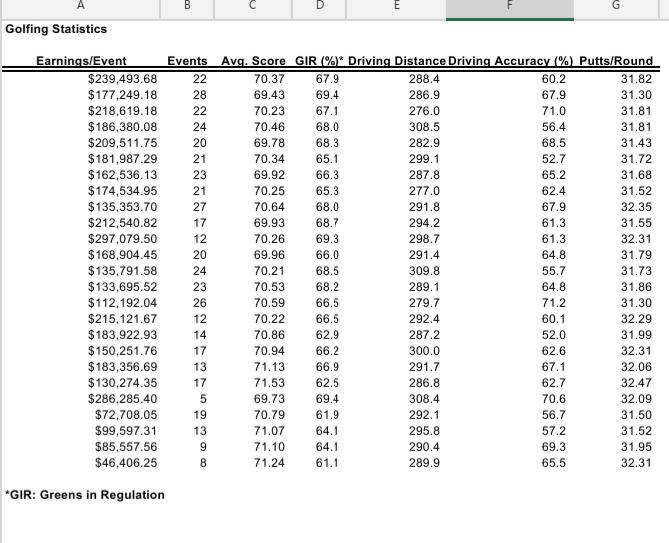
B D Golfing Statistics Earnings/Event Events $239,493.68 22 $177,249.18 28 $218,619.18 22 $186,380.08 24 $209,511.75 20 $181,987.29 21 $162,536.13 23 $174,534.95 21 $135,353.70 27 $212,540.82 17 $297,079.50 12 $168,904.45 20 $135,791.58 24 $133,695.52 23 $112,192.04 26 $215,121.67 12 $183,922.93 14 $150,251.76 17 $183,356.69 13 $130,274.35 17 $286,285.40 5 $72,708.05 19 $99,597.31 13 $85,557.56 9 $46,406.25 8 Avg. Score GIR%* Driving Distance Driving Accuracy (%) Putts/Round 70.37 67.9 288.4 60.2 31.82 69,43 69.4 286.9 67.9 31.30 70.23 67.1 276.0 71.0 31.81 70.46 68.0 308.5 56.4 31.81 69.78 68.3 282.9 68.5 31.43 70.34 65.1 299.1 52.7 31.72 69.92 66.3 287.8 65.2 31.68 70.25 65.3 277.0 62.4 31.52 70.64 68.0 291.8 67.9 32.35 69.93 68.7 294.2 61.3 31.55 70.26 69.3 298.7 61.3 32.31 69.96 66.0 291.4 64.8 31.79 70.21 68.5 309.8 55.7 31.73 70.53 68.2 289.1 64.8 31.86 70.59 66.5 279.7 71.2 31.30 70.22 66.5 292.4 60.1 32.29 70.86 62.9 287.2 52.0 31.99 70.94 66.2 300.0 62.6 32.31 71.13 66.9 291.7 67.1 32.06 71.53 62.5 286.8 62.7 32.47 69.73 69.4 308.4 70.6 32.09 70.79 61.9 292.1 56.7 31.50 71.07 64.1 295.8 57.2 31.52 71.10 64.1 290.4 69.3 31.95 71.24 61.1 289.9 65.5 32.31 "GIR: Greens in Regulation B D Golfing Statistics Earnings/Event Events $239,493.68 22 $177,249.18 28 $218,619.18 22 $186,380.08 24 $209,511.75 20 $181,987.29 21 $162,536.13 23 $174,534.95 21 $135,353.70 27 $212,540.82 17 $297,079.50 12 $168,904.45 20 $135,791.58 24 $133,695.52 23 $112,192.04 26 $215,121.67 12 $183,922.93 14 $150,251.76 17 $183,356.69 13 $130,274.35 17 $286,285.40 5 $72,708.05 19 $99,597.31 13 $85,557.56 9 $46,406.25 8 Avg. Score GIR%* Driving Distance Driving Accuracy (%) Putts/Round 70.37 67.9 288.4 60.2 31.82 69,43 69.4 286.9 67.9 31.30 70.23 67.1 276.0 71.0 31.81 70.46 68.0 308.5 56.4 31.81 69.78 68.3 282.9 68.5 31.43 70.34 65.1 299.1 52.7 31.72 69.92 66.3 287.8 65.2 31.68 70.25 65.3 277.0 62.4 31.52 70.64 68.0 291.8 67.9 32.35 69.93 68.7 294.2 61.3 31.55 70.26 69.3 298.7 61.3 32.31 69.96 66.0 291.4 64.8 31.79 70.21 68.5 309.8 55.7 31.73 70.53 68.2 289.1 64.8 31.86 70.59 66.5 279.7 71.2 31.30 70.22 66.5 292.4 60.1 32.29 70.86 62.9 287.2 52.0 31.99 70.94 66.2 300.0 62.6 32.31 71.13 66.9 291.7 67.1 32.06 71.53 62.5 286.8 62.7 32.47 69.73 69.4 308.4 70.6 32.09 70.79 61.9 292.1 56.7 31.50 71.07 64.1 295.8 57.2 31.52 71.10 64.1 290.4 69.3 31.95 71.24 61.1 289.9 65.5 32.31 "GIR: Greens in Regulation
Step by Step Solution
There are 3 Steps involved in it

Get step-by-step solutions from verified subject matter experts