

Question: 1.RR Q=1 2. Feedback q=1 3. Feedback q = 2 i a. Draw grant chart b. calculate waiting time for each process and average waiting
1.RR Q=1
2. Feedback q=1
3. Feedback q = 2i
a. Draw grant chart
b. calculate waiting time for each process and average waiting time.
c. calculate TAT for each process and ATAT.
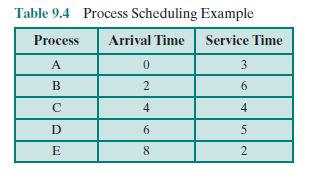
Table 9.4 Process Scheduling Example Process Arrival Time Service Time 4
Step by Step Solution
There are 3 Steps involved in it
1 Expert Approved Answer
Step: 1 Unlock

Question Has Been Solved by an Expert!
Get step-by-step solutions from verified subject matter experts
Step: 2 Unlock
Step: 3 Unlock