

Question: 1.Statistics for three stocks A, B & C are shown in the following tables: Standard Deviation Return Stock A 40% 15% Stock B 20% 10%
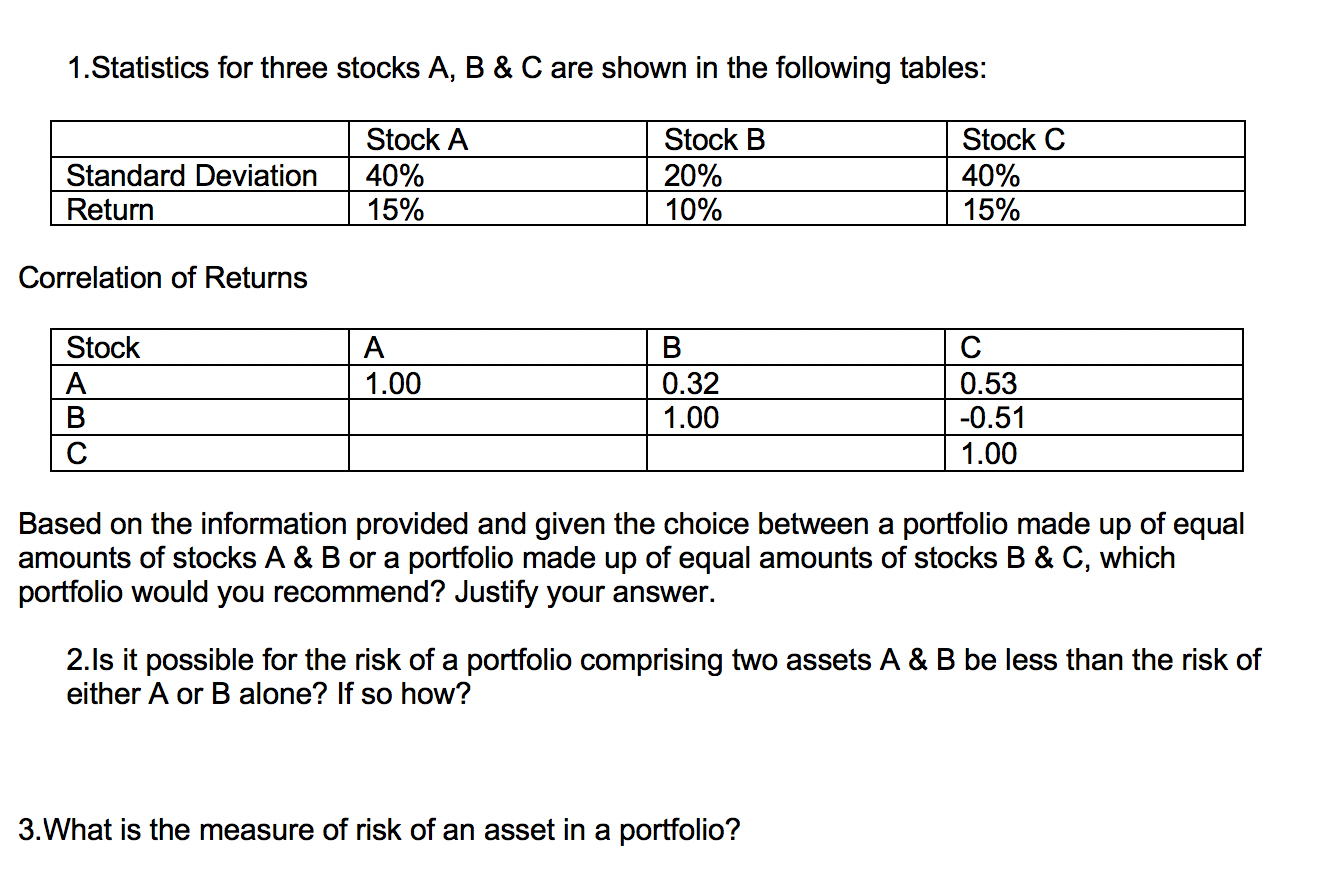
1.Statistics for three stocks A, B & C are shown in the following tables: Standard Deviation Return Stock A 40% 15% Stock B 20% 10% Stock C 40% 15% Correlation of Returns A 1.00 Stock A B B 0.32 1.00 0.53 -0.51 1.00 Based on the information provided and given the choice between a portfolio made up of equal amounts of stocks A & B or a portfolio made up of equal amounts of stocks & C, which portfolio would you recommend? Justify your answer. 2.Is it possible for the risk of a portfolio comprising two assets A & B be less than the risk of either A or B alone? If so how? 3.What is the measure of risk of an asset in a portfolio
Step by Step Solution
There are 3 Steps involved in it
1 Expert Approved Answer
Step: 1 Unlock

Question Has Been Solved by an Expert!
Get step-by-step solutions from verified subject matter experts
Step: 2 Unlock
Step: 3 Unlock