

Question: 1-tests are often presented in tables, as in the below table from Slesnick and Guo (2013). Look at the table and answer the questions below.
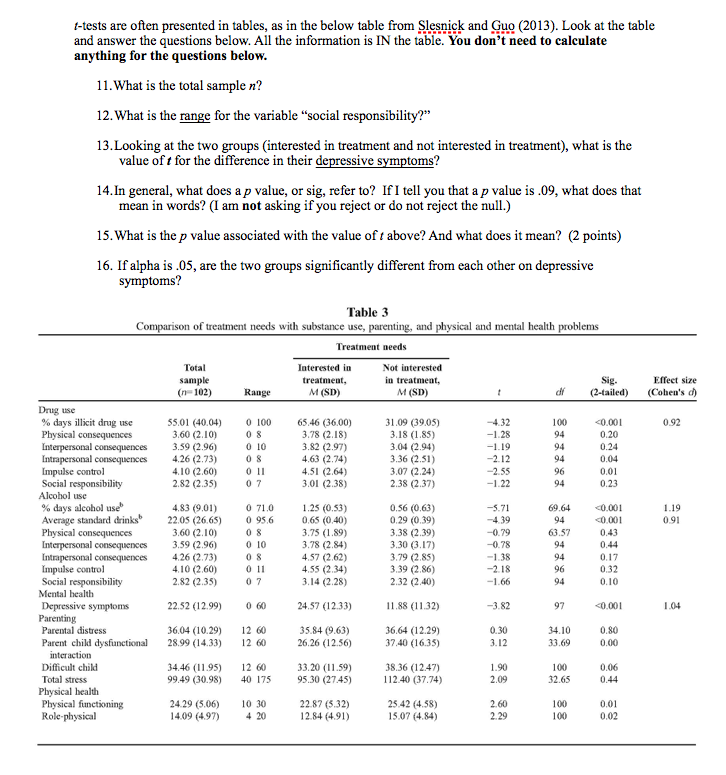
1-tests are often presented in tables, as in the below table from Slesnick and Guo (2013). Look at the table and answer the questions below. All the information is IN the table. You don't need to calculate anything for the questions below. 11. What is the total sample n? 12. What is the range for the variable "social responsibility?" 13. Looking at the two groups (interested in treatment and not interested in treatment), what is the value of t for the difference in their depressive symptoms? 14. In general, what does a p value, or sig, refer to? If I tell you that a p value is.09, what does that mean in words? (I am not asking if you reject or do not reject the null.) 15. What is the p value associated with the value of t above? And what does it mean? (2 points) 16. If alpha is .05, are the two groups significantly different from each other on depressive symptoms? Effect size (Cohen's c) 100 0.92 -1.22 Table 3 Comparison of treatment needs with substance use, parenting, and physical and mental health problems Treatment needs Total Interested in Not interested sample treatment, in treatment, Sig. (n-102) Range (SD) (SD) dr (2-tailed) Drug use % days illicit drug use 55.01 (40.04) 0 100 65.46 (36.00) 31.09 (39.05) -4.32
Step by Step Solution
There are 3 Steps involved in it

Get step-by-step solutions from verified subject matter experts