

Question: 1.The base year is 2013 and data below reflects pricing information. OpenStax Mado Ch 11 Practice Set - Word Search ign Layout References Mailings Review


1.The base year is 2013 and data below reflects pricing information.
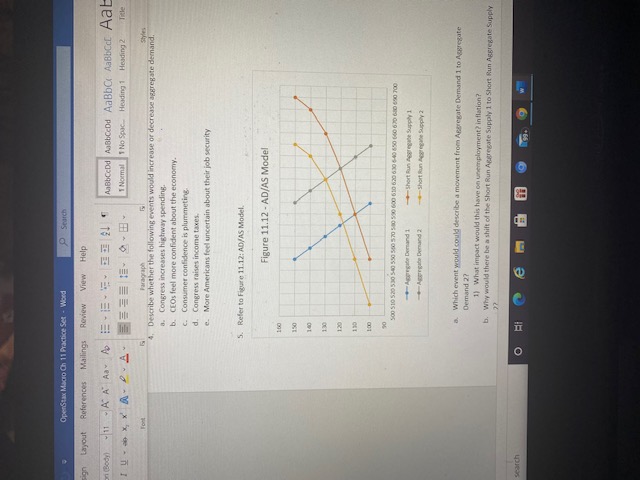
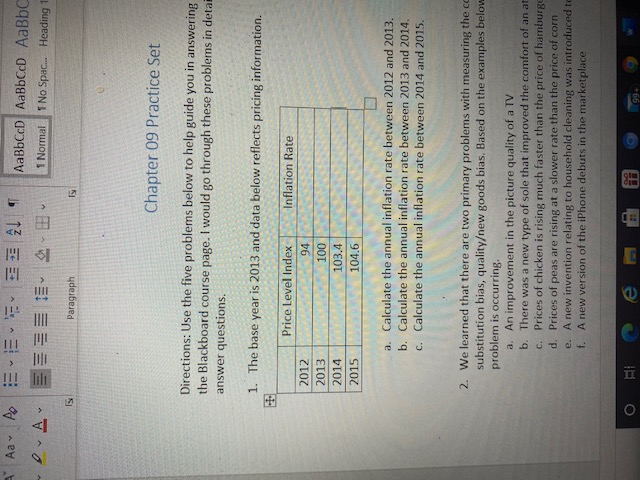
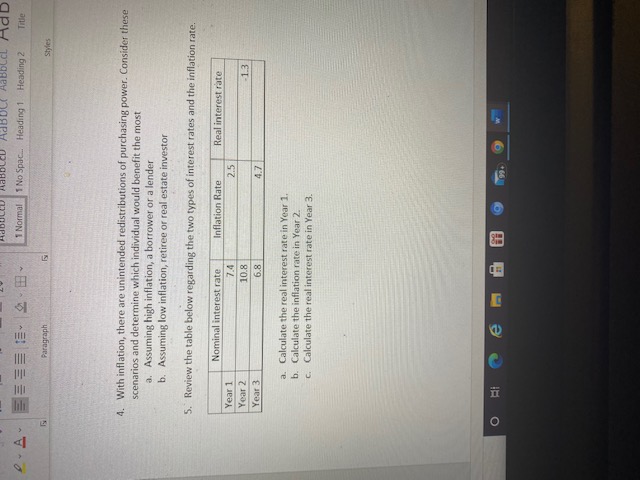
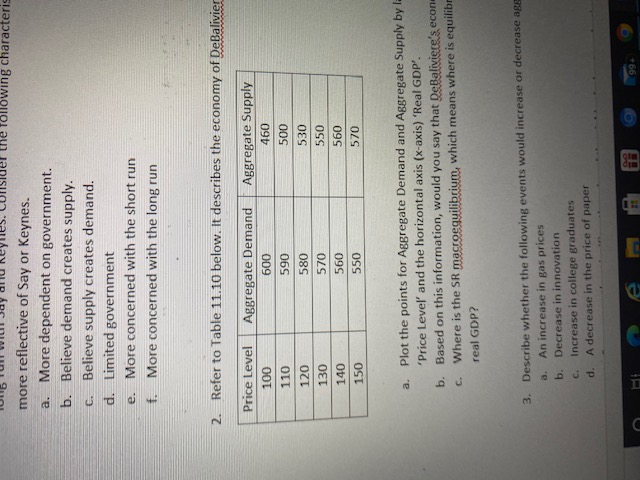
OpenStax Mado Ch 11 Practice Set - Word Search ign Layout References Mailings Review View Help n Body + 11 - AA AT A AnBbCeDd AJobCcDd AaBbCe AaBbect Aab I Normal 1 No Spic Heading 1 Heading 2 Paragraph Describe whether the following events would increase or decrease appregate demand. a. Congress increases highway spending. b. CEOs feel more confident about the economy. c. Consumer confidence is plummeting d. Congress raises income taxes. e. More Americans feel uncertain about their job security 5. Refer to Figure 11.12: AD/AS Model. Figure 11.12 - AD/AS Model 150 500 510 520530 5-43 553 390 570 30579 680 610 6706304-45 530 010670 680870 708 Short Run Agoogle Supply 1 Agree Demand 1 Short Ian Ageright Supply Which event would could describe a movement from Aggregate Demand 1 to Aggregate Demand 27 1) What impact would this have on unemployment? in flation? b. Why would there be a shift of the Short Run Aggregate Supply 1 to Short Run Aggregate Supply search O HI 9 WAay AaBbCCD AaBbCcD AaBbC A Normal I No Spac... Heading Paragraph Chapter 09 Practice Set Directions: Use the five problems below to help guide you in answering the Blackboard course page. I would go through these problems in detai answer questions. 1. The base year is 2013 and data below reflects pricing information. Price Level Index Inflation Rate 2012 94 2013 100 2014 103.4 2015 104.6 a. Calculate the annual inflation rate between 2012 and 2013. b. Calculate the annual inflation rate between 2013 and 2014. c. Calculate the annual inflation rate between 2014 and 2015. 2. We learned that there are two primary problems with measuring the co substitution bias, qualityew goods bias. Based on the examples below problem is occurring. a. An improvement in the picture quality of a TV b. There was a new type of sole that improved the comfort of an at c. Prices of chicken is rising much faster than the price of hamburg d. Prices of peas are rising at a slower rate than the price of corn e. A new invention relating to household cleaning was introduced t f. A new version of the iphone debuts in the marketplace O 92Normal 1 No Spac. Heading 1 Heading 2 Title Paragraph Styles 4. With inflation, there are unintended redistributions of purchasing power. Consider these scenarios and determine which individual would benefit the most a, Assuming high inflation, a borrower or a lender b. Assuming low inflation, retiree or real estate investor 5. Review the table below regarding the two types of interest rates and the inflation rate. Nominal interest rate Inflation Rate Real interest rate Year 1 7.4 2.5 Year 2 10.8 -1.3 Year 3 6.8 4.7 a. Calculate the real interest rate in Year 1. b. Calculate the inflation rate in Year 2. c. Calculate the real interest rate in Year 3. OHIconsider the following characteris more reflective of Say or Keynes. a. More dependent on government. b. Believe demand creates supply. C. Believe supply creates demand. d. Limited government e. More concerned with the short run f. More concerned with the long run 2. Refer to Table 11.10 below. It describes the economy of DeBalivie Price Level Aggregate Demand Aggregate Supply 100 600 460 110 590 500 120 580 530 130 570 550 140 560 560 150 550 570 a. Plot the points for Aggregate Demand and Aggregate Supply by I "Price Level' and the horizontal axis (x-axis) 'Real GDP". b. Based on this information, would you say that DeBaliviere's econ c. Where is the SR macroequilibrium, which means where is equilib real GDP? 3. Describe whether the following events would increase or decrease ag a. An increase in gas prices b. Decrease in innovation c. Increase in college graduates d. A decrease in the price of paper 99+
Step by Step Solution
There are 3 Steps involved in it

Get step-by-step solutions from verified subject matter experts