

1.The figure to the right is the position-versus-time graph of a jogger. a) What is the joggers...
Fantastic news! We've Found the answer you've been seeking!
Question:
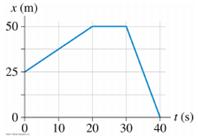
1.The figure to the right is the position-versus-time graph of a jogger. a) What is the jogger’s velocity at t = 10 s, at t = 25 s, and at t = 35 s? b) Find his average speed between 10 s and 35 s. c) what is the jogger’s average velocity and average speed for the overall trip (0 s to 40 s)? (d) Draw the velocity vs time graph of this motion [11]
Expert Answer:

Related Book For 

Operations Management Creating Value Along the Supply Chain
ISBN: 978-0470525906
7th Edition
Authors: Roberta S. Russell, Bernard W. Taylor
Posted Date:
