

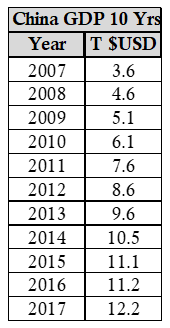
Question: 1.The Table in this problem provides China GDP for the years 2007 through 2017 in T $USD. a. Develop a histogram/bar chart for the data
1.The Table in this problem provides China GDP for the years 2007 through 2017 in T $USD.
a. Develop a histogram/bar chart for the data above using tools in LEO or elsewhere (like Excel)
b. Compute mean, median and mode for the values as they appear in the table
\f
Step by Step Solution
There are 3 Steps involved in it
1 Expert Approved Answer
Step: 1 Unlock

Question Has Been Solved by an Expert!
Get step-by-step solutions from verified subject matter experts
Step: 2 Unlock
Step: 3 Unlock