

Question: ( 2 0 points ) The table below presents the returns on stocks ABC and XYZ over a five - year period. table [
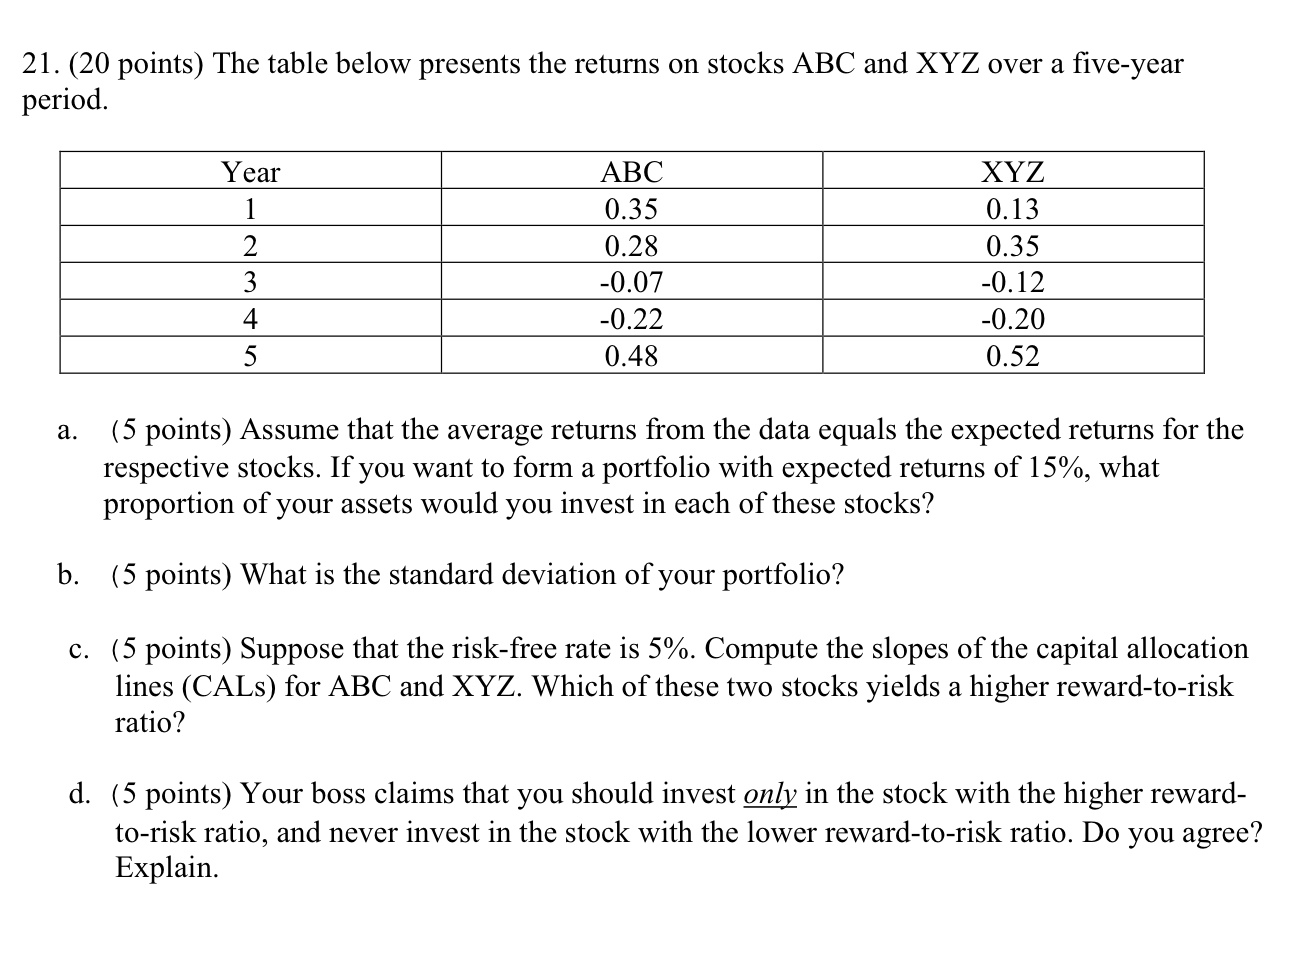
points The table below presents the returns on stocks ABC and XYZ over a fiveyear period.
tableYearABC,XYZ
a points Assume that the average returns from the data equals the expected returns for the respective stocks. If you want to form a portfolio with expected returns of what proportion of your assets would you invest in each of these stocks?
b points What is the standard deviation of your portfolio?
c points Suppose that the riskfree rate is Compute the slopes of the capital allocation lines CALs for ABC and XYZ Which of these two stocks yields a higher rewardtorisk ratio?
d points Your boss claims that you should invest only in the stock with the higher rewardtorisk ratio, and never invest in the stock with the lower rewardtorisk ratio. Do you agree? Explain.
Step by Step Solution
There are 3 Steps involved in it
1 Expert Approved Answer
Step: 1 Unlock

Question Has Been Solved by an Expert!
Get step-by-step solutions from verified subject matter experts
Step: 2 Unlock
Step: 3 Unlock