

Question: ( 2 0 % ) Problem 4 : For the Bode plot shown in the figure below: a . Find the Gain Crossing Frequency g
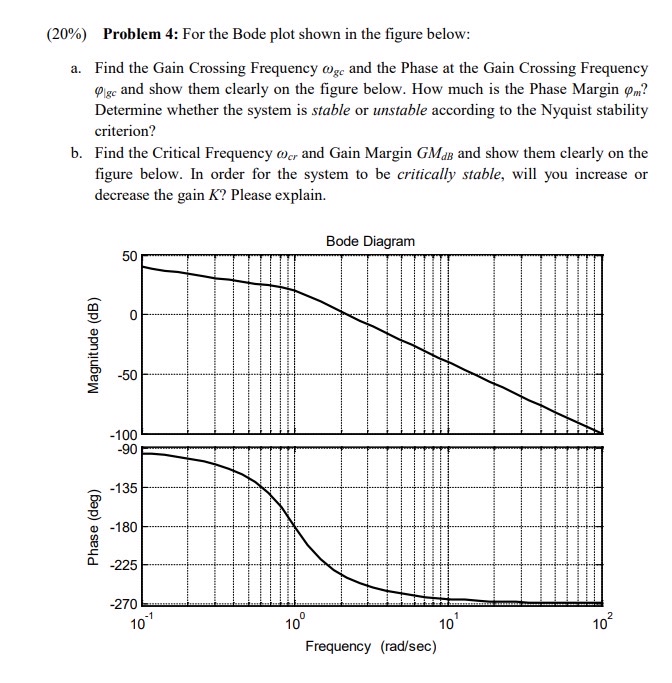
Problem : For the Bode plot shown in the figure below:
a Find the Gain Crossing Frequency and the Phase at the Gain Crossing Frequency and show them clearly on the figure below. How much is the Phase Margin Determine whether the system is stable or unstable according to the Nyquist stability criterion?
b Find the Critical Frequency and Gain Margin and show them clearly on the figure below. In order for the system to be critically stable, will you increase or decrease the gain Please explain.
Step by Step Solution
There are 3 Steps involved in it
1 Expert Approved Answer
Step: 1 Unlock

Question Has Been Solved by an Expert!
Get step-by-step solutions from verified subject matter experts
Step: 2 Unlock
Step: 3 Unlock