

Question: 2 1 2 3 4 5 7 3 2 6 0 3 6 8 4 5 Time Table Process ID Exit Time Turn Around Time
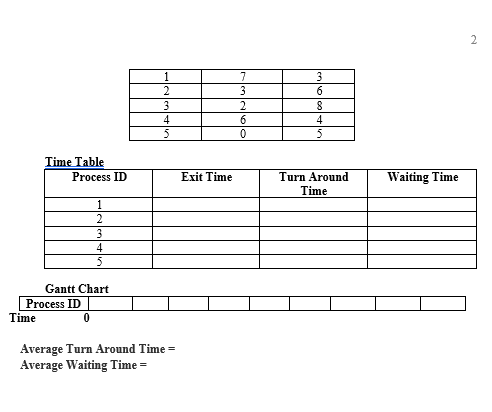
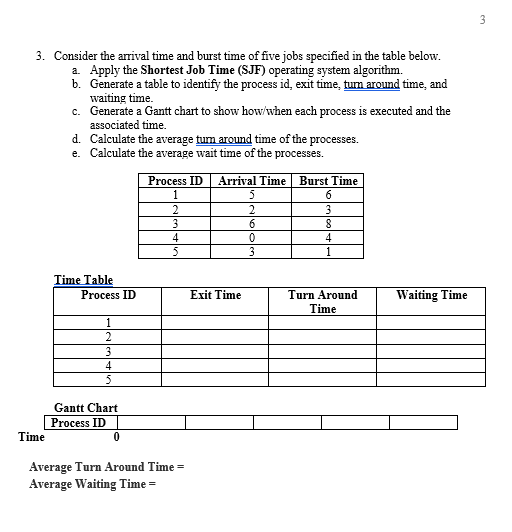
2 1 2 3 4 5 7 3 2 6 0 3 6 8 4 5 Time Table Process ID Exit Time Turn Around Time Waiting Time 1 2 3 4 5 Gantt Chart Process ID Time 0 Average Turn Around Time = Average Waiting Time = 3 3. Consider the arrival time and burst time of five jobs specified in the table below. a. Apply the shortest Job Time (SJF) operating system algorithm. b. Generate a table to identify the process id, exit time, tum around time, and waiting time. C. Generate a Gantt chart to show how/when each process is executed and the associated time. d. Calculate the average tum around time of the processes. e. Calculate the average wait time of the processes. Process ID 1 2 3 4 5 Arrival Time 5 2 6 0 3 Burst Time 6 3 8 4 1 Time Table Process ID Exit Time Turn Around Time Waiting Time 1 2 3 4 5 Gantt Chart Process ID Time 0 Average Turn Around Time = Average Waiting Time
Step by Step Solution
There are 3 Steps involved in it

Get step-by-step solutions from verified subject matter experts