

Question: 2 1 point -DO The following frequency graph shows the monthly spending of a group of students on their cell phones. Find each of
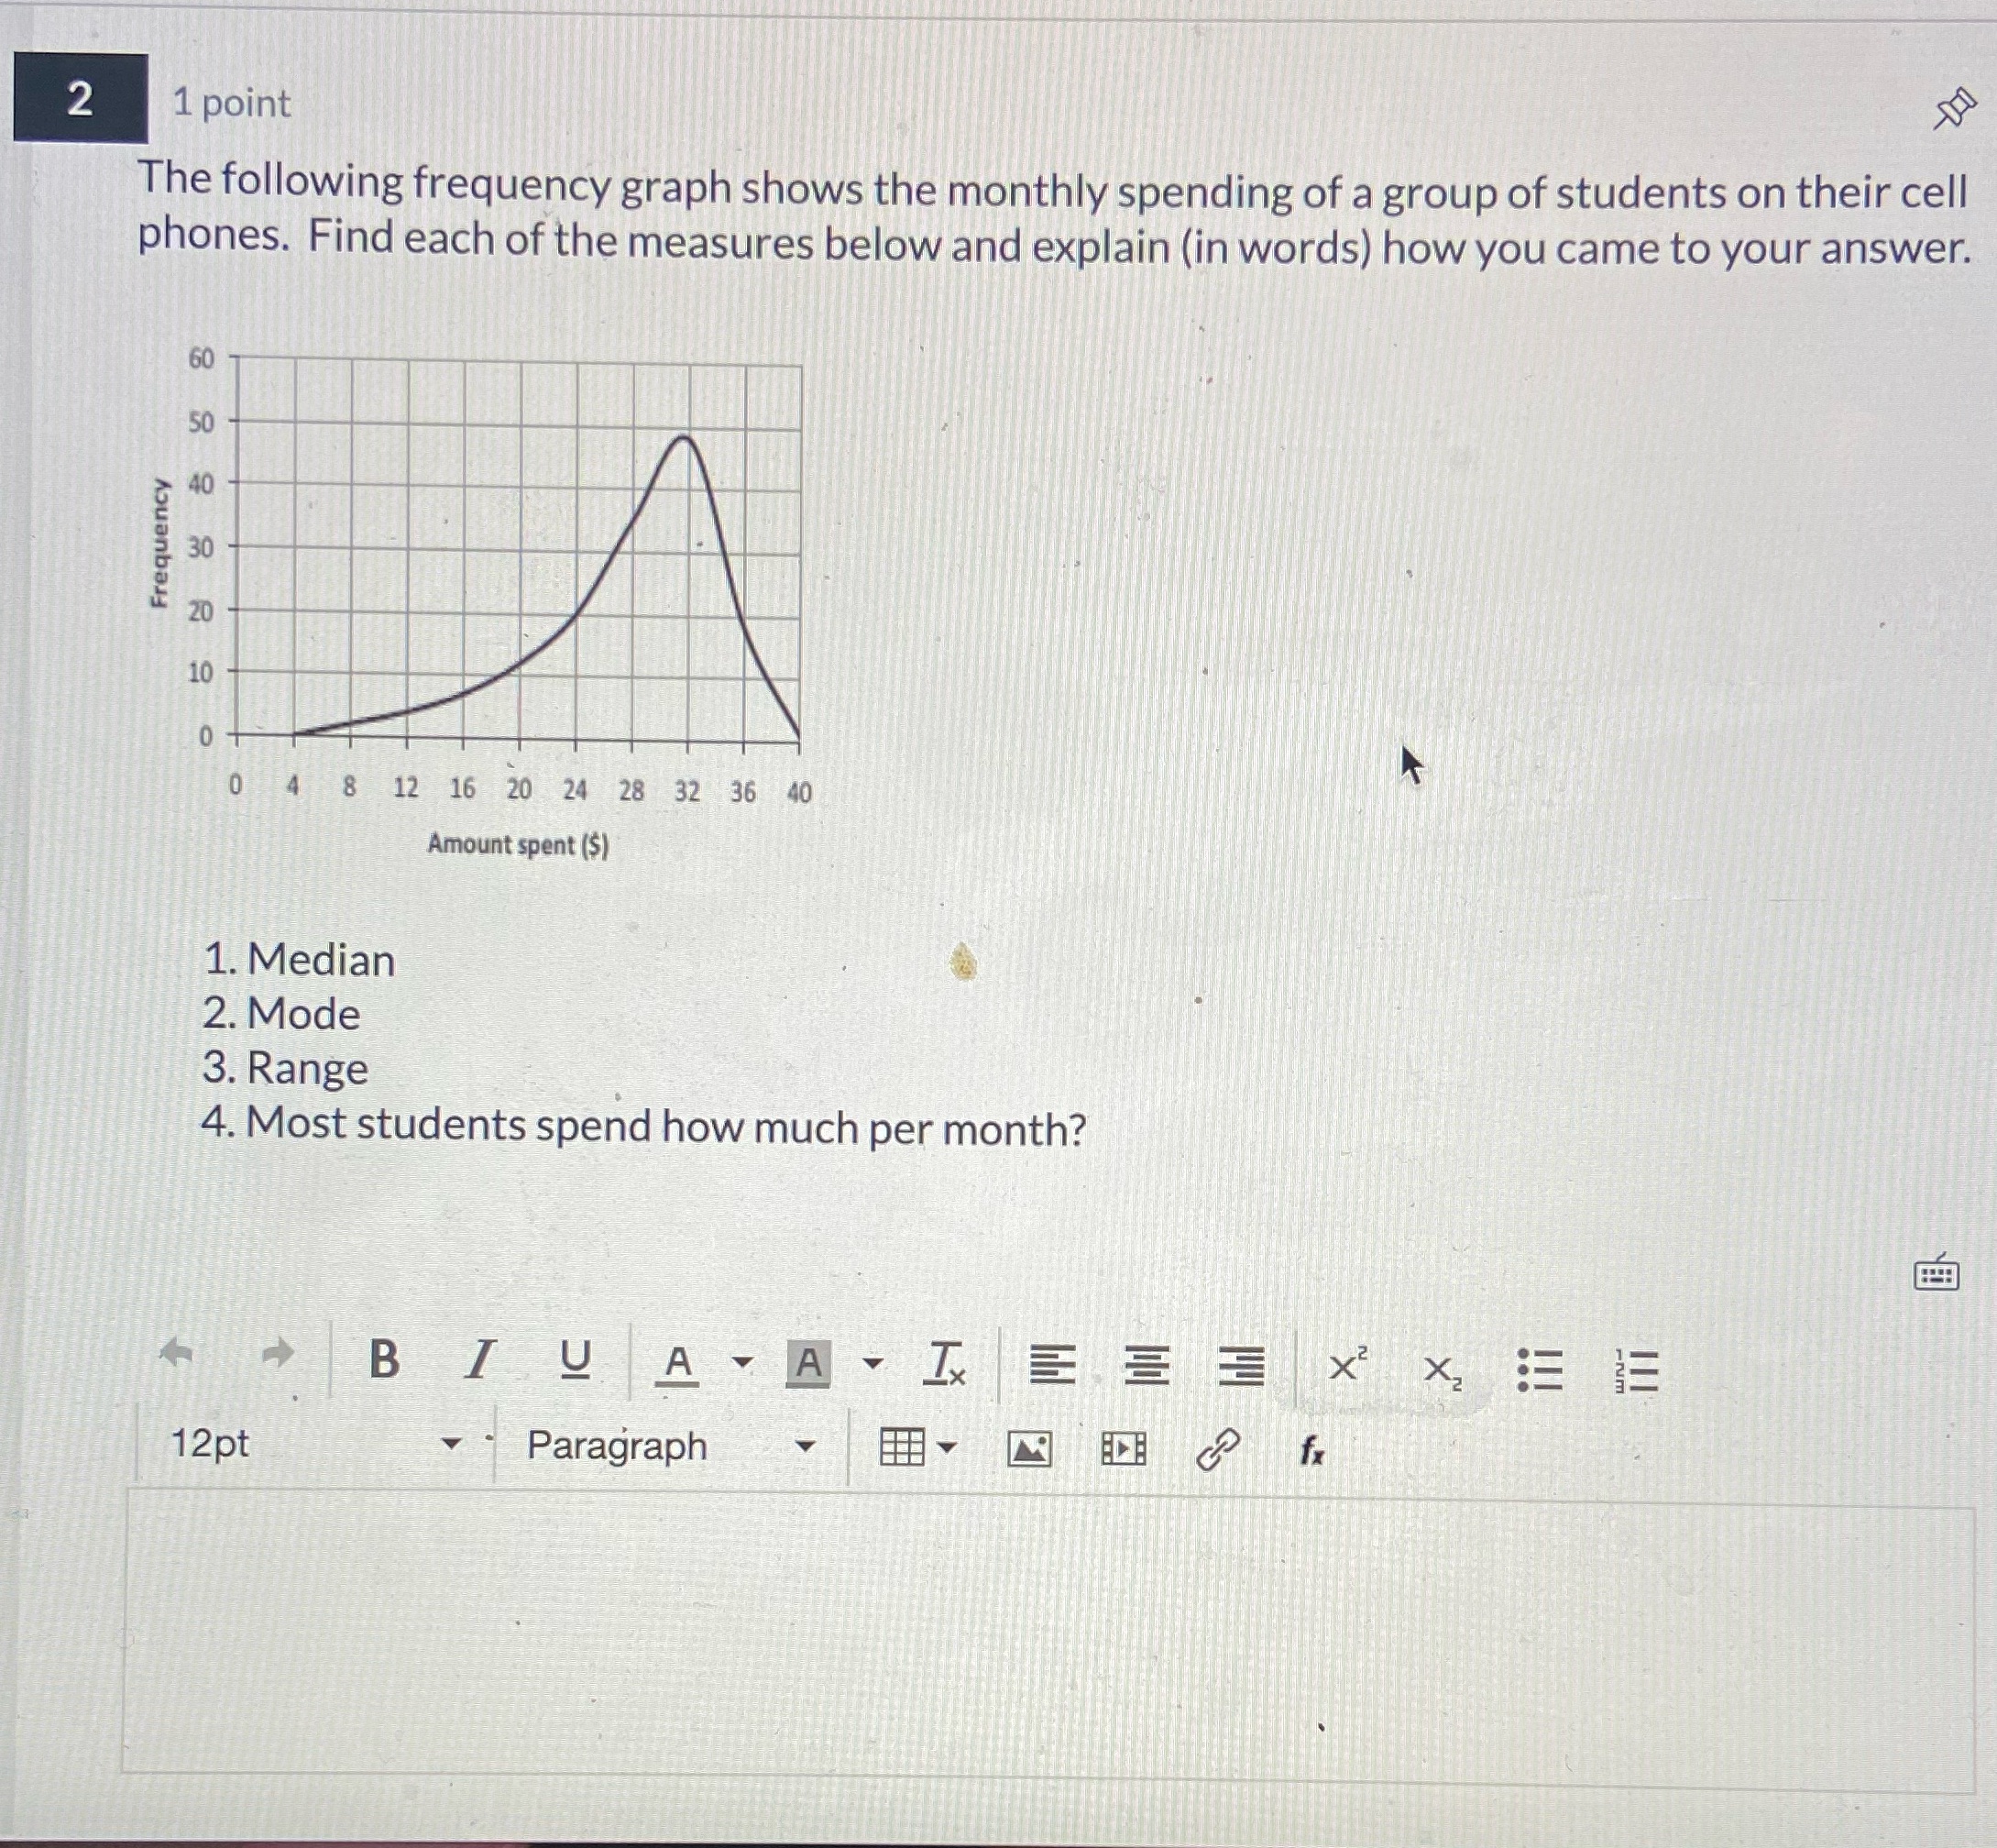
2 1 point -DO The following frequency graph shows the monthly spending of a group of students on their cell phones. Find each of the measures below and explain (in words) how you came to your answer. Frequency 60 50 30 20 10 89 40 0+ 0 4 8 12 16 20 24 28 32 36 40 Amount spent ($) 1. Median 2. Mode 3. Range 4. Most students spend how much per month? 12pt BIU A A TX Paragraph x fx
Step by Step Solution
There are 3 Steps involved in it
1 Expert Approved Answer
Step: 1 Unlock

Question Has Been Solved by an Expert!
Get step-by-step solutions from verified subject matter experts
Step: 2 Unlock
Step: 3 Unlock