

Question: 2 . 1 . Value Chain Analysis You may use this illustration to explain the value chain analysis if you wish. Or . you can
Value Chain Analysis
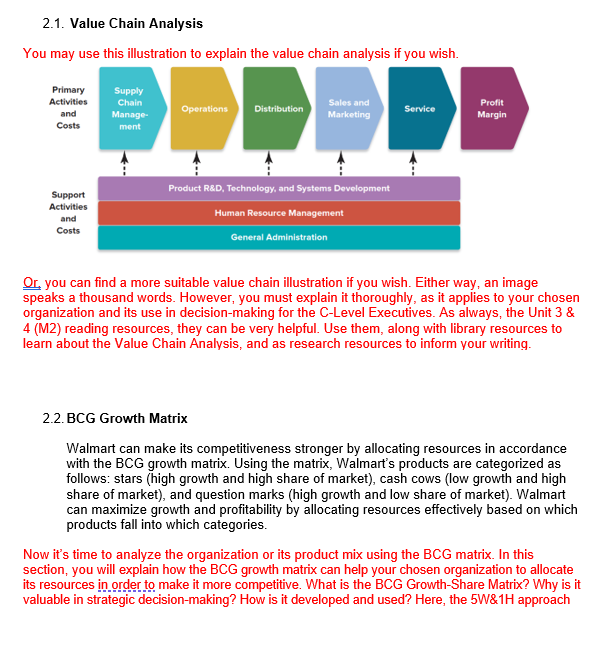
You may use this illustration to explain the value chain analysis if you wish.
Or you can find a more suitable value chain illustration if you wish. Either way, an image
speaks a thousand words. However, you must explain it thoroughly, as it applies to your chosen
organization and its use in decisionmaking for the CLevel Executives. As always, the Unit &
M reading resources, they can be very helpful. Use them, along with library resources to
learn about the Value Chain Analysis, and as research resources to inform your writing.
BCG Growth Matrix
Walmart can make its competitiveness stronger by allocating resources in accordance
with the BCG growth matrix. Using the matrix, Walmart's products are categorized as
follows: stars high growth and high share of market cash cows low growth and high
share of market and question marks high growth and low share of market Walmart
can maximize growth and profitability by allocating resources effectively based on which
products fall into which categories.
Now it's time to analyze the organization or its product mix using the BCG matrix. In this
section, you will explain how the BCG growth matrix can help your chosen organization to allocate
its resources in order to make it more competitive. What is the BCG GrowthShare Matrix? Why is it
valuable in strategic decisionmaking? How is it developed and used? Here, the W&H approach
Step by Step Solution
There are 3 Steps involved in it
1 Expert Approved Answer
Step: 1 Unlock

Question Has Been Solved by an Expert!
Get step-by-step solutions from verified subject matter experts
Step: 2 Unlock
Step: 3 Unlock