

Question: 2. (10 marks) Suppose you are working as data scientist for the Deputy Premier and Min- ister for Education to the Victorian Parliament, the
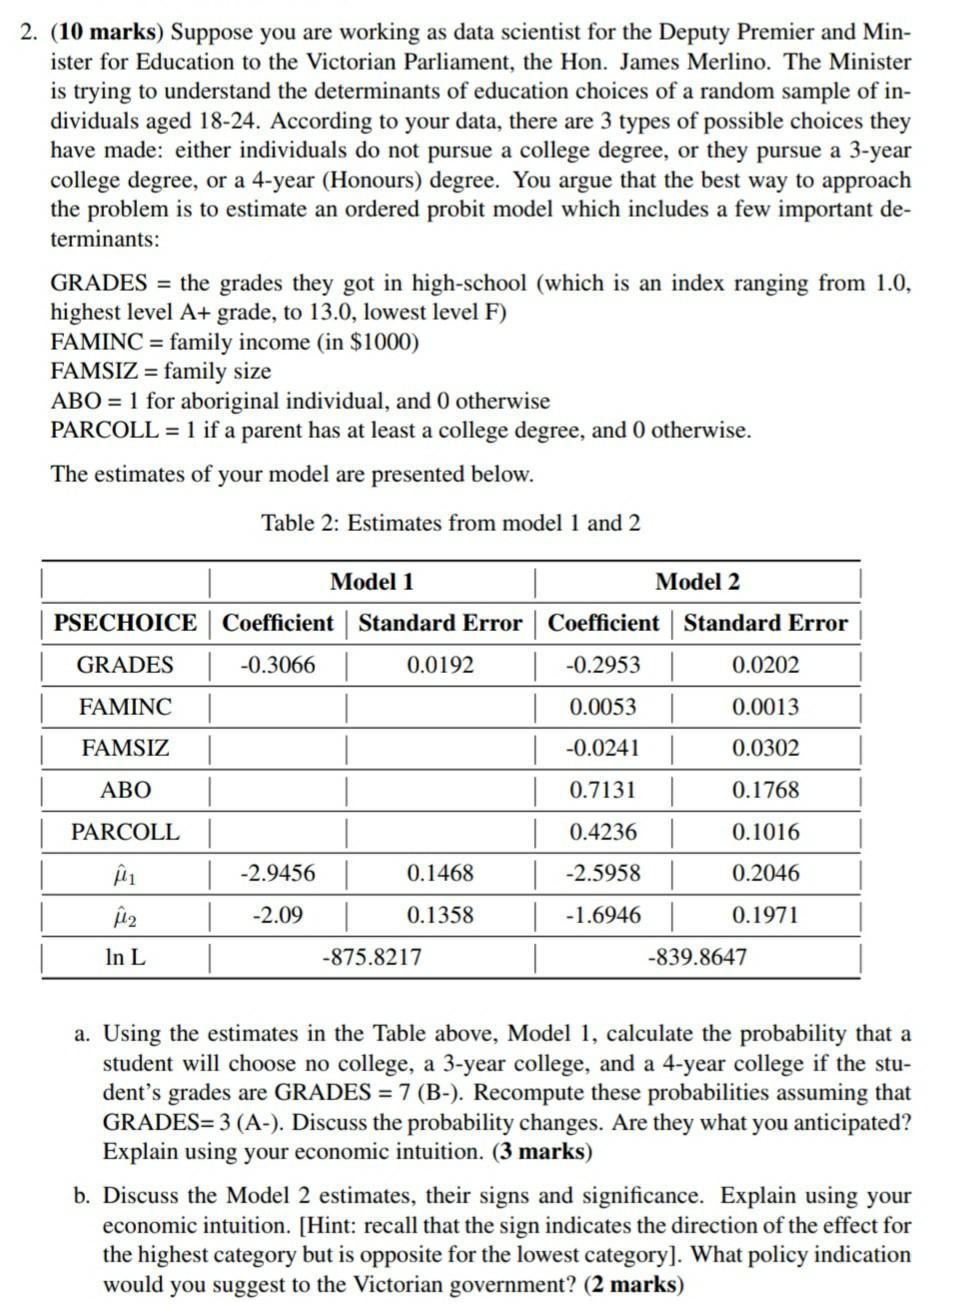
2. (10 marks) Suppose you are working as data scientist for the Deputy Premier and Min- ister for Education to the Victorian Parliament, the Hon. James Merlino. The Minister is trying to understand the determinants of education choices of a random sample of in- dividuals aged 18-24. According to your data, there are 3 types of possible choices they have made: either individuals do not pursue a college degree, or they pursue a 3-year college degree, or a 4-year (Honours) degree. You argue that the best way to approach the problem is to estimate an ordered probit model which includes a few important de- terminants: GRADES = the grades they got in high-school (which is an index ranging from 1.0, highest level A+ grade, to 13.0, lowest level F) FAMINC = family income (in $1000) FAMSIZ = family size ABO = 1 for aboriginal individual, and 0 otherwise PARCOLL = 1 if a parent has at least a college degree, and 0 otherwise. The estimates of your model are presented below. PSECHOICE GRADES FAMINC FAMSIZ ABO PARCOLL In L Table 2: Estimates from model 1 and 2 Model 1 Coefficient Standard Error Coefficient -0.3066 -0.2953 0.0053 -0.0241 0.7131 0.4236 -2.5958 -1.6946 -2.9456 -2.09 0.0192 0.1468 0.1358 -875.8217 Model 2 Standard Error 0.0202 0.0013 0.0302 0.1768 0.1016 0.2046 0.1971 -839.8647 a. Using the estimates in the Table above, Model 1, calculate the probability that a student will choose no college, a 3-year college, and a 4-year college if the stu- dent's grades are GRADES = 7 (B-). Recompute these probabilities assuming that GRADES= 3 (A-). Discuss the probability changes. Are they what you anticipated? Explain using your economic intuition. (3 marks) b. Discuss the Model 2 estimates, their signs and significance. Explain using your economic intuition. [Hint: recall that the sign indicates the direction of the effect for the highest category but is opposite for the lowest category]. What policy indication would you suggest to the Victorian government? (2 marks) c. Test the joint significance of the variables added in (b) using a likelihood ratio test at the 1% level of significance. Show how you do this. Explain the meaning of the result in economic terms. (1 marks) d. Compute the probability that an aboriginal student from a household of four mem- bers with $100,000 income, and with at least one parent having at least a college degree, so that PARCOLL = 1, will attend a 4-year college if (i) GRADES = 7 and (ii) GRADES = 3. What would be your policy conclusion from this? (2 marks) e. Repeat (d) for a "non-aboriginal" student and discuss the economic differences in your findings. What would be your policy conclusion from this? (2 marks)
Step by Step Solution
3.45 Rating (164 Votes )
There are 3 Steps involved in it
A For Model 1 when GRADES 7 B The probability of choosing no college is 02717 the probability ... View full answer

Get step-by-step solutions from verified subject matter experts