

Question: 2) (10 points) Consider this diagram which shows the effect of a decrease in the price of good X (from BC1 to BC2). The original
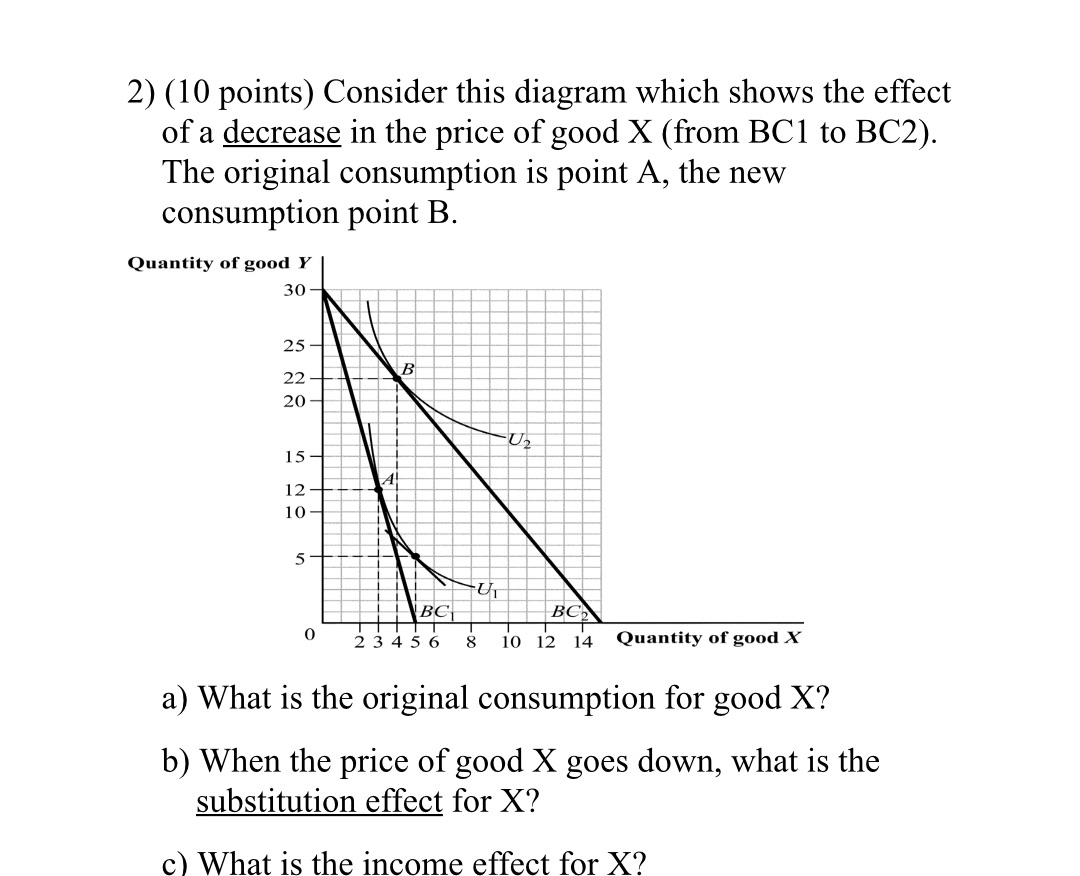
2) (10 points) Consider this diagram which shows the effect of a decrease in the price of good X (from BC1 to BC2). The original consumption is point A, the new consumption point B. Quantity of good Y 30- 25 U2 BC BC O 23456 8 10 12 14 Quantity of good X a) What is the original consumption for good X? b) When the price of good X goes down, what is the substitution effect for X? c) What is the income effect for X
Step by Step Solution
There are 3 Steps involved in it
1 Expert Approved Answer
Step: 1 Unlock

Question Has Been Solved by an Expert!
Get step-by-step solutions from verified subject matter experts
Step: 2 Unlock
Step: 3 Unlock