

Question: 2. (10 points) Test the hypothesis that the population mean log wage is equal for black and nonblack men. First, write down the null
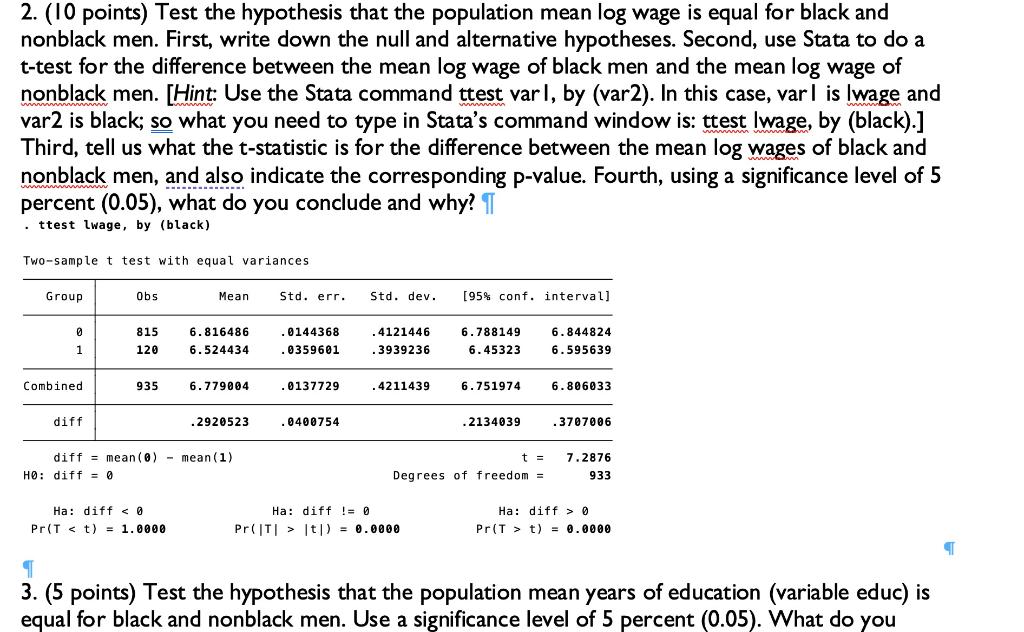
2. (10 points) Test the hypothesis that the population mean log wage is equal for black and nonblack men. First, write down the null and alternative hypotheses. Second, use Stata to do a t-test for the difference between the mean log wage of black men and the mean log wage of nonblack men. [Hint: Use the Stata command ttest varl, by (var2). In this case, var is wage and var2 is black; so what you need to type in Stata's command window is: ttest Iwage, by (black).] Third, tell us what the t-statistic is for the difference between the mean log wages of black and nonblack men, and also indicate the corresponding p-value. Fourth, using a significance level of 5 percent (0.05), what do you conclude and why? . ttest lwage, by (black) Two-sample t test with equal variances Group Obs Mean Std. err. Std. dev.. [95% conf. interval] 0 815 6.816486 .0144368 1 120 6.524434 .0359601 .4121446 .3939236 6.788149 6.844824 6.45323 6.595639 Combined 935 6.779004 .0137729 .4211439 6.751974 6.806033 diff .2920523 .0400754 .2134039 .3707006 diff mean (0) mean (1) t = H0 diff = 0 Degrees of freedom = 7.2876 933 Ha: diff < 0 Pr(T 0 Pr(Tt) = 0.0000 3. (5 points) Test the hypothesis that the population mean years of education (variable educ) is equal for black and nonblack men. Use a significance level of 5 percent (0.05). What do you
Step by Step Solution
There are 3 Steps involved in it

Get step-by-step solutions from verified subject matter experts