

Question: 2. (15 points) The graph of a function f(x) on the interval [0, 8] is shown in the figure below. Estimate So f (x) da
![interval [0, 8] is shown in the figure below. Estimate So f](https://s3.amazonaws.com/si.experts.images/answers/2024/06/666614e5c11c8_053666614e591417.jpg)
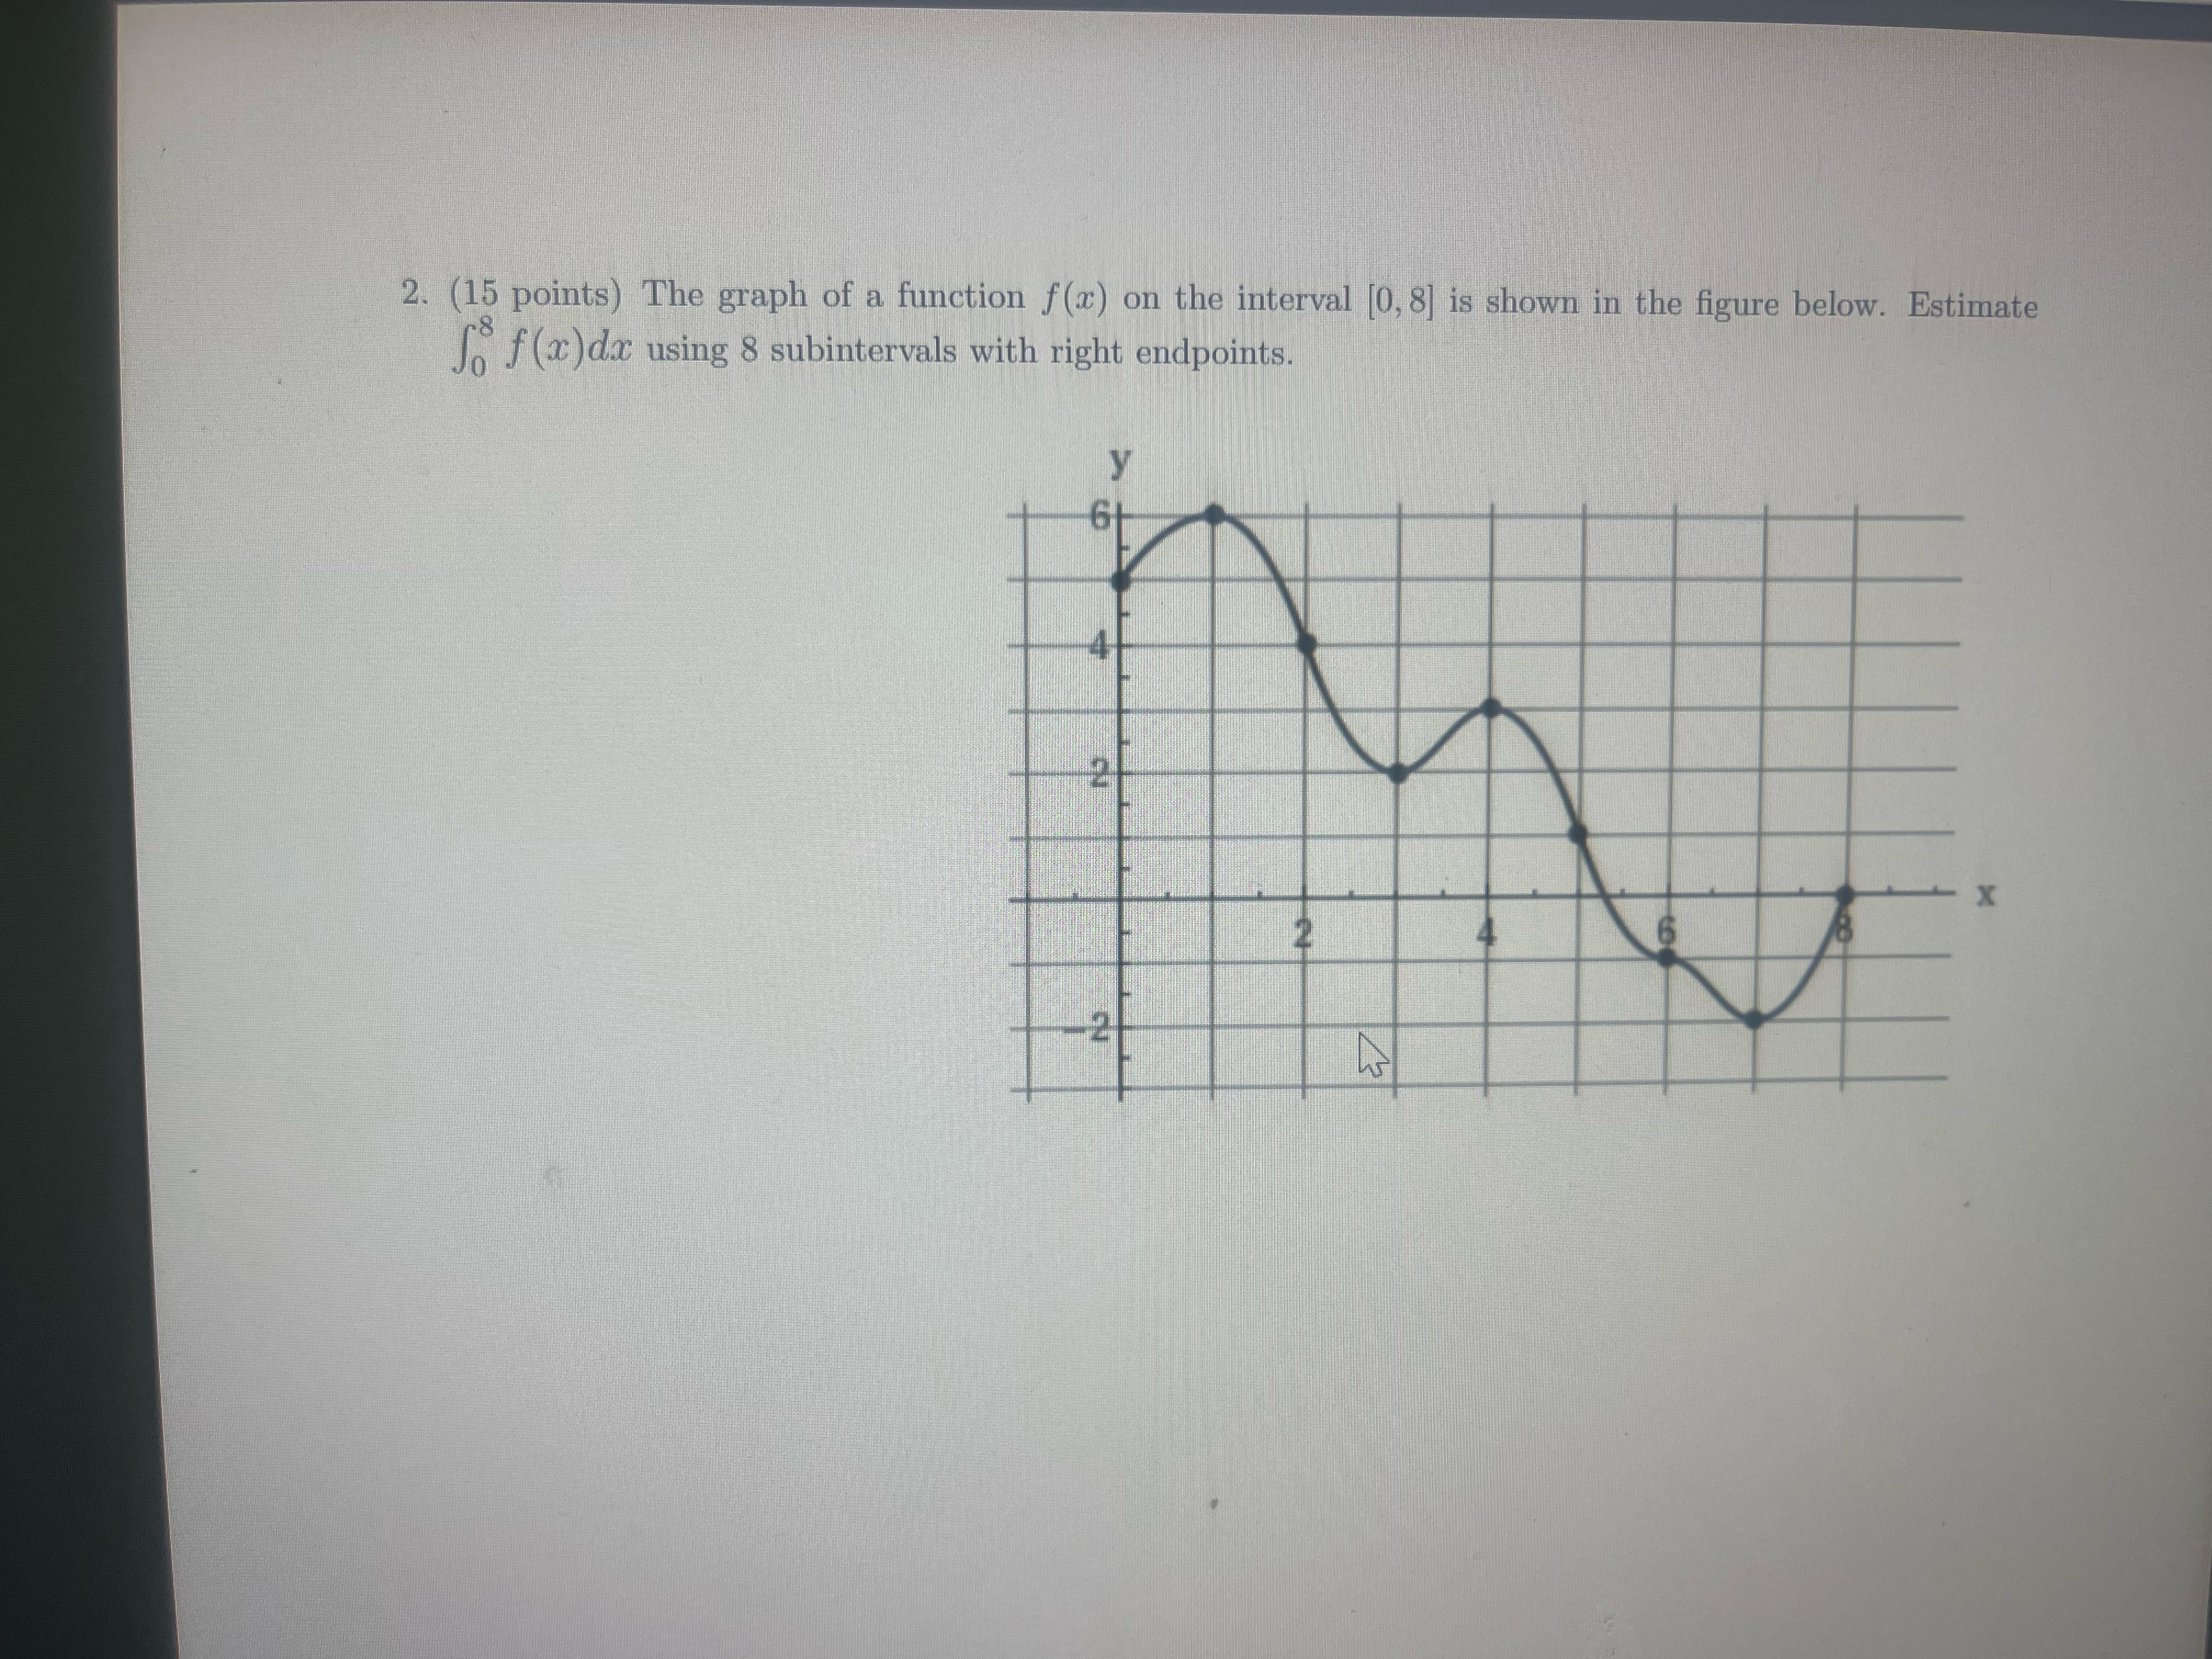
2. (15 points) The graph of a function f(x) on the interval [0, 8] is shown in the figure below. Estimate So f (x) da using 8 subintervals with right endpoints
Step by Step Solution
There are 3 Steps involved in it
1 Expert Approved Answer
Step: 1 Unlock

Question Has Been Solved by an Expert!
Get step-by-step solutions from verified subject matter experts
Step: 2 Unlock
Step: 3 Unlock