

Question: 2. (19 points) The following table provides data representing forest growth. Assume that timber can be sold for S2/cubic foot (ft), harvest costs are S0.40
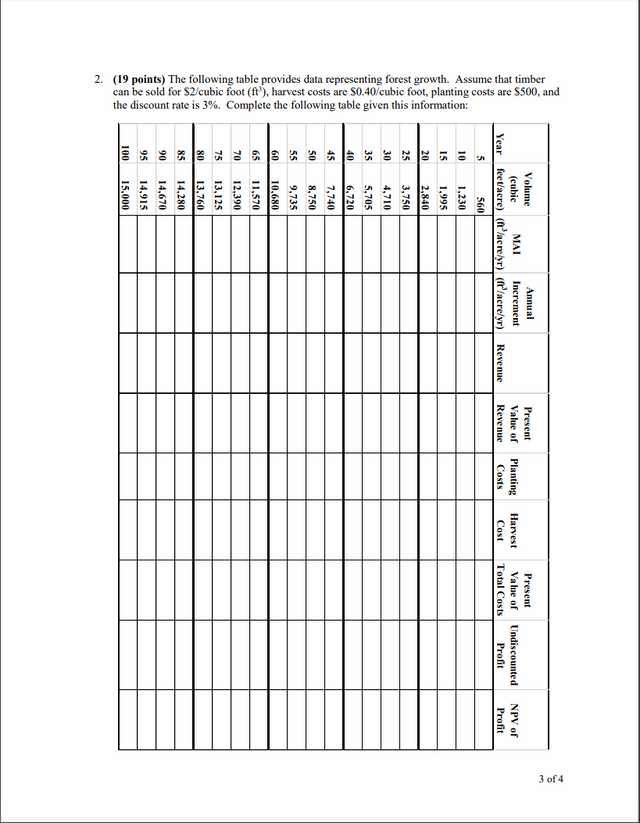
2. (19 points) The following table provides data representing forest growth. Assume that timber can be sold for S2/cubic foot (ft), harvest costs are S0.40 cubic foot, planting costs are S500, and the discount rate is 3%. Complete the following table given this information: 3 of 4 a. In which year is the MAl the highest? b. If you do not discount revenue and costs, which year provides the most profit? c. When revenue and costs are discounted, in which year should you harvest? d. What is the net present value of profits in the optimal harvest year? e. How would the optimal year to harvest the timber change if the discount rate was higher? Please discuss 2. (19 points) The following table provides data representing forest growth. Assume that timber can be sold for S2/cubic foot (ft), harvest costs are S0.40 cubic foot, planting costs are S500, and the discount rate is 3%. Complete the following table given this information: 3 of 4 a. In which year is the MAl the highest? b. If you do not discount revenue and costs, which year provides the most profit? c. When revenue and costs are discounted, in which year should you harvest? d. What is the net present value of profits in the optimal harvest year? e. How would the optimal year to harvest the timber change if the discount rate was higher? Please discuss
Step by Step Solution
There are 3 Steps involved in it

Get step-by-step solutions from verified subject matter experts