

Question: ( 2 . 2 5 points ) The table below shows prices for fruit that the typical college student purchased from 2 0 1 1
points The table below shows prices for fruit that the typical college student purchased from to Use the table to answer parts A through below.
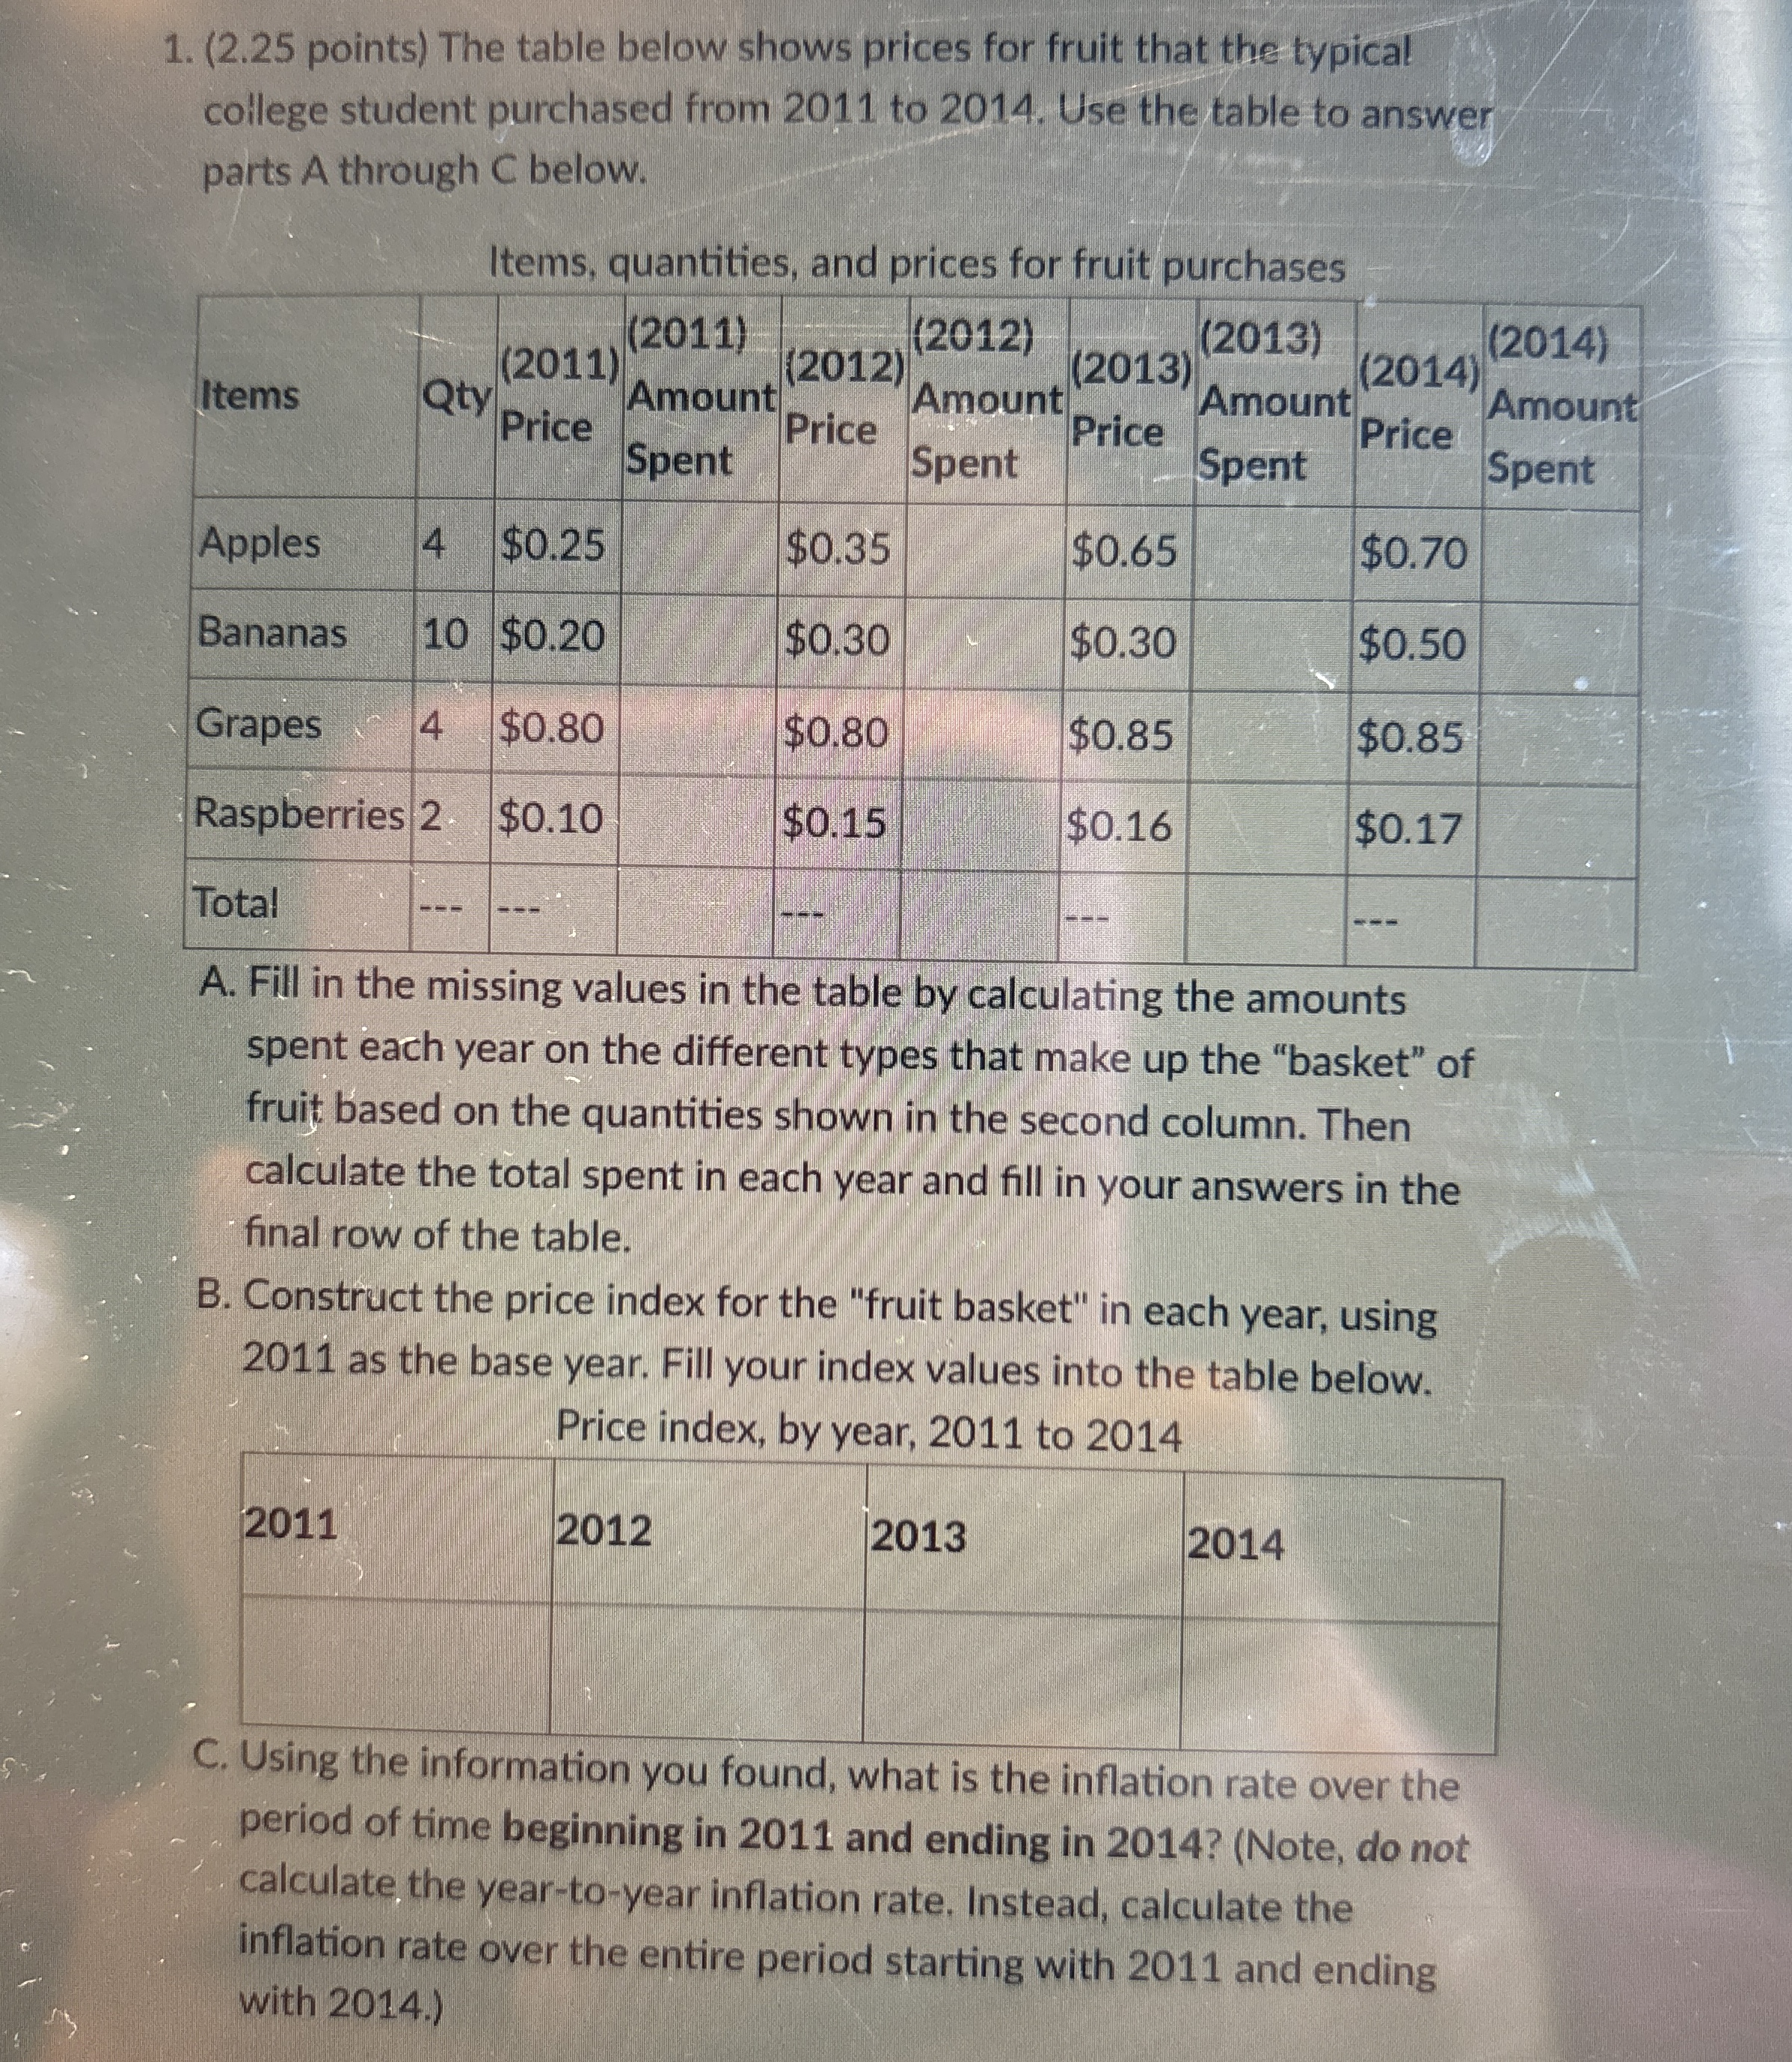
Items, quantities, and prices for fruit purchases
tableItemsQtytablePricetableAmountSpenttablePricetableAmountSpenttablePricetableAmountSpenttableAmountSpentApples$$$$Bananas$$$$Grapes$$$$Raspberries$$$$Total
A Fill in the missing values in the table by calculating the amounts spent each year on the different types that make up the "basket" of fruit based on the quantities shown in the second column. Then calculate the total spent in each year and fill in your answers in the final row of the table.
B Construct the price index for the "fruit basket" in each year, using as the base year. Fill your index values into the table below.
Price index, by year, to
table
C Using the information you found, what is the inflation rate over the period of time beginning in and ending in Note do not calculate, the yeartoyear inflation rate. Instead, calculate the inflation rate over the entire period starting with and ending with
Step by Step Solution
There are 3 Steps involved in it
1 Expert Approved Answer
Step: 1 Unlock

Question Has Been Solved by an Expert!
Get step-by-step solutions from verified subject matter experts
Step: 2 Unlock
Step: 3 Unlock