

Question: 2 2 7 6 4 1 4 For the sample data in the table above, find: E(x - 2)2 Round a to one decimal when
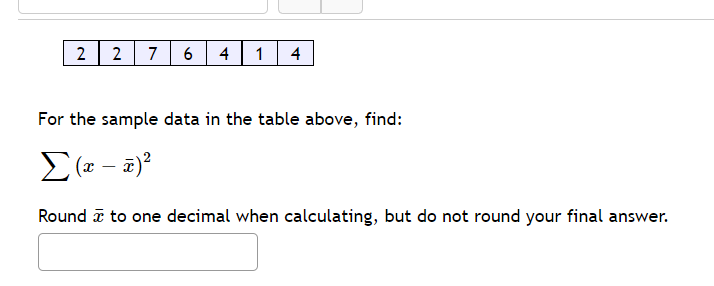
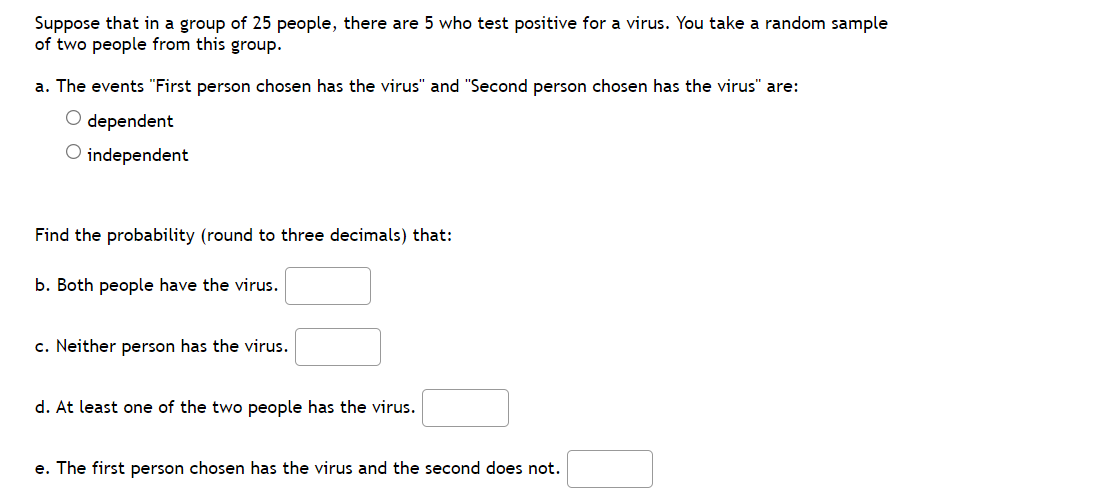
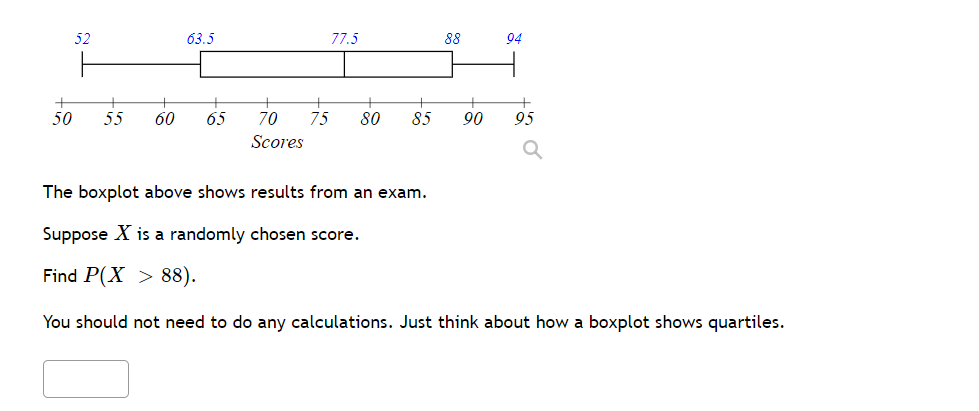

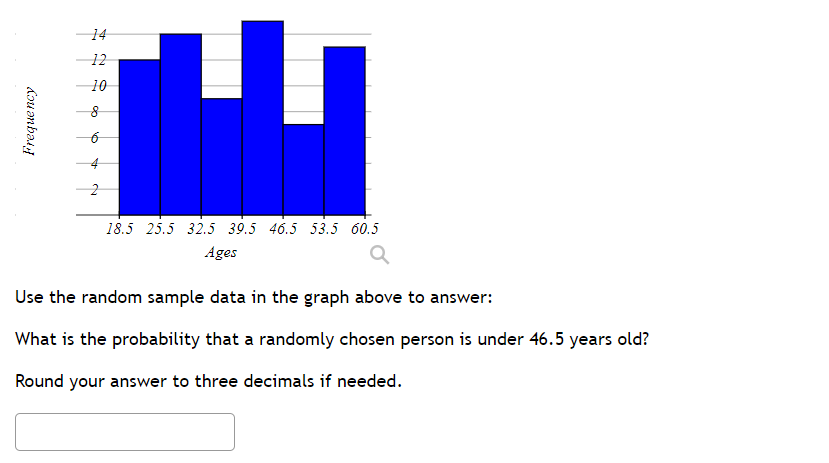


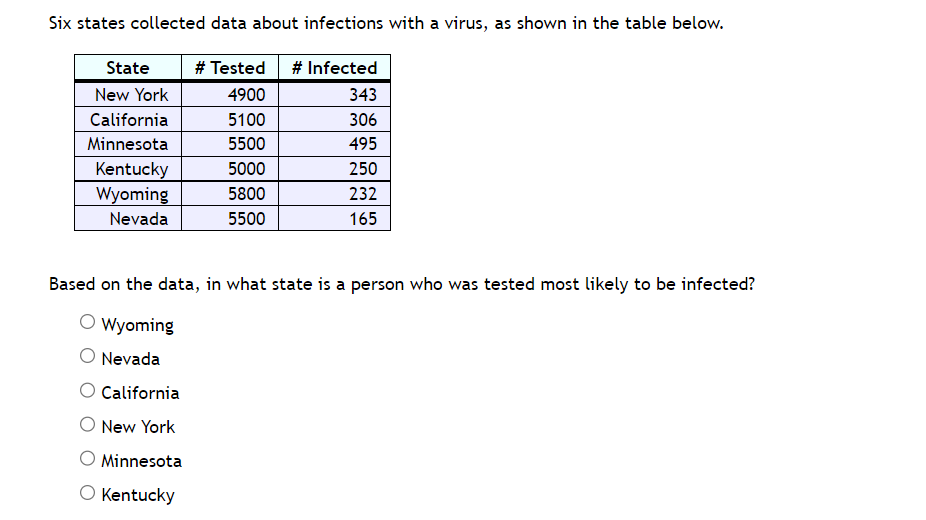

2 2 7 6 4 1 4 For the sample data in the table above, find: E(x - 2)2 Round a to one decimal when calculating, but do not round your final answer.Suppose that in a group of 25 people, there are 5 who test positive for a virus. You take a random sample of two people from this group. a. The events "First person chosen has the virus" and "Second person chosen has the virus" are: '33:} dependent '33:} independent Find the probability [round to three decimals) that: b. Both people have the virus. c. Neither person has the virus. d. At least one of the two people has the virus. e. The first person chosen has the virus and the second does not. 04 52 63.5 77.5 88 50 55 60 65 70 75 80 85 90 95 Scores Q The boxplot above shows results from an exam. Suppose X is a randomly chosen score. Find P(X > 88). You should not need to do any calculations. Just think about how a boxplot shows quartiles.Six states collected data about infections with a virus, as shown in the table below. State # Tested # Infected New York 4900 343 California 5100 306 Minnesota 5500 495 Kentucky 5000 250 Wyoming 5800 232 Nevada 5500 165 Based on the data, in what state is a person who was tested most likely to be infected? O Wyoming O Nevada O California O New York O Minnesota O Kentucky14 12 10 Frequency 18.5 25.5 32.5 39.5 46.5 53.5 60.5 Ages Use the random sample data in the graph above to answer: What is the probability that a randomly chosen person is under 46.5 years old? Round your answer to three decimals if needed
Step by Step Solution
There are 3 Steps involved in it

Get step-by-step solutions from verified subject matter experts