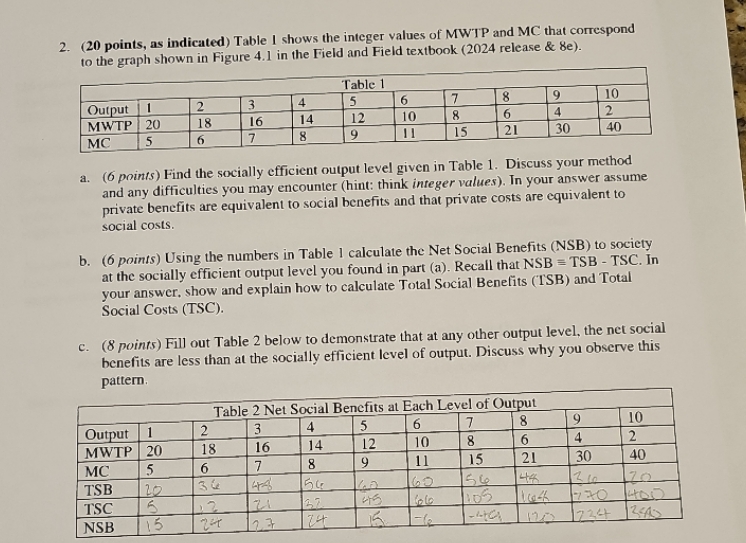
Question: 2. (20 points, as indicated) Table I shows the integer values of MWTP and MC that correspond to the graph shown in Figure 4.1 in

2. (20 points, as indicated) Table I shows the
2. (20 points, as indicated) Table I shows the integer values of MWTP and MC that correspond to the graph shown in Figure 4.1 in the Field and Field textbook (2024 release & Be). Table 1 Output 1 2 3 4 5 6 7 8 9 10 MWTP 20 18 16 14 12 10 8 6 4 2 MC 5 7 8 9 11 15 21 30 40 a. (6 points) Find the socially efficient output level given in Table 1. Discuss your method and any difficulties you may encounter (hint: think integer values). In your answer assume private benefits are equivalent to social benefits and that private costs are equivalent to social costs. b. (6 points) Using the numbers in Table I calculate the Net Social Benefits (NSB) to society at the socially efficient output level you found in part (a). Recall that NSB = TSB - TSC. In your answer, show and explain how to calculate Total Social Benefits (TSB) and Total Social Costs (TSC). c. (8 points) Fill out Table 2 below to demonstrate that at any other output level, the net social benefits are less than at the socially efficient level of output. Discuss why you observe this pattern. Table 2 Net Social Benefits at Each Level of Output Output 1 2 3 4 5 6 7 8 9 10 MWTP 20 18 16 14 12 10 8 6 4 2 MC 5 6 7 9 11 15 21 30 40 TSB 20 34 TSC NSB 15 23 15 1724 1243

Step by Step Solution

There are 3 Steps involved in it

1 Expert Approved Answer
Step: 1 Unlock blur-text-image
Question Has Been Solved by an Expert!

Get step-by-step solutions from verified subject matter experts

Step: 2 Unlock
Step: 3 Unlock

Students Have Also Explored These Related Law Questions!