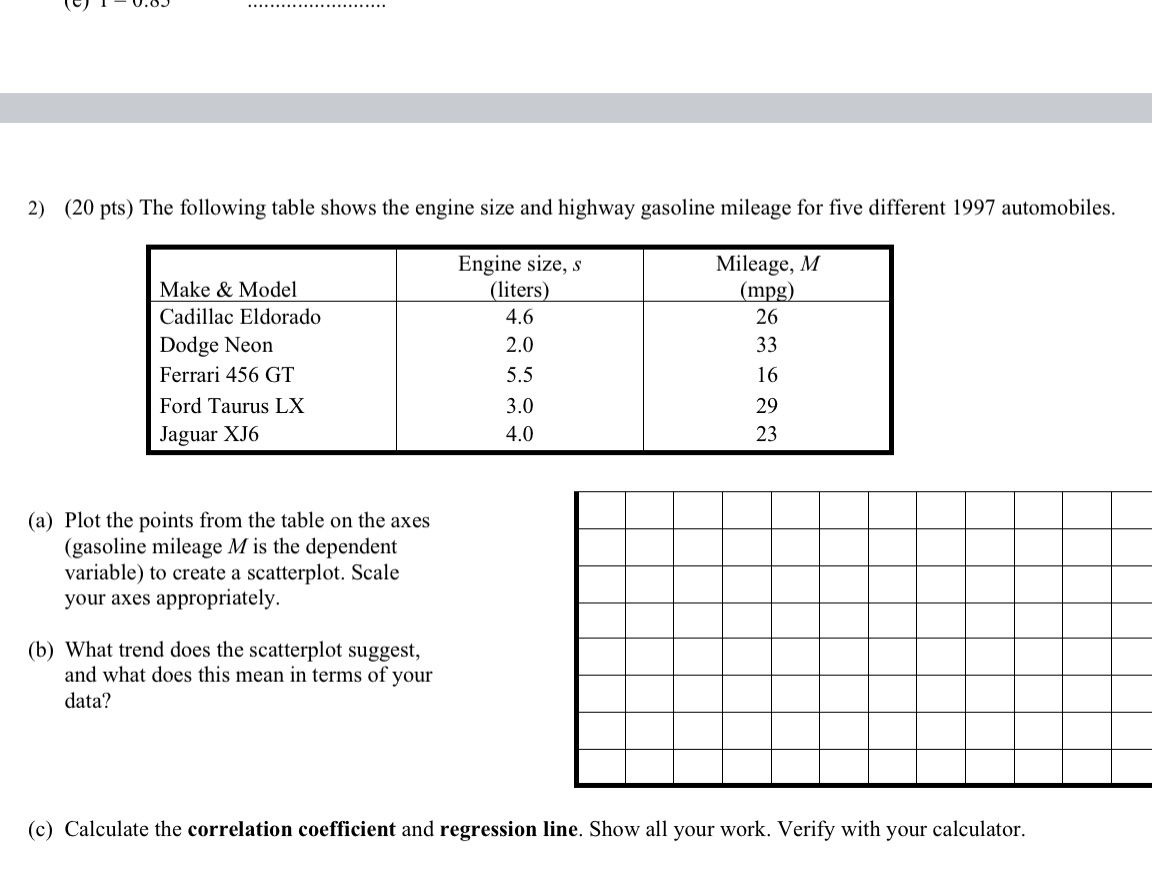
Question: 2) (20 pts) The following table shows the engine size and highway gasoline mileage for five different 1997 automobiles. Engine size, s Mileage, M Make

image text in transcribed
2) (20 pts) The following table shows the engine size and highway gasoline mileage for five different 1997 automobiles. Engine size, s Mileage, M Make & Model (liters) (mpg) Cadillac Eldorado 4.6 26 Dodge Neon 2.0 33 Ferrari 456 GT 5.5 16 Ford Taurus LX 3.0 29 Jaguar XJ6 4.0 23 (a) Plot the points from the table on the axes (gasoline mileage M is the dependent variable) to create a scatterplot. Scale your axes appropriately. (b) What trend does the scatterplot suggest, and what does this mean in terms of your data? (c) Calculate the correlation coefficient and regression line. Show all your work. Verify with your calculator

Step by Step Solution

There are 3 Steps involved in it

1 Expert Approved Answer
Step: 1 Unlock blur-text-image
Question Has Been Solved by an Expert!

Get step-by-step solutions from verified subject matter experts

Step: 2 Unlock
Step: 3 Unlock

Students Have Also Explored These Related Mathematics Questions!