

Question: i need answer!!!!! The following table shows the engine size and highway gasoline mileage for five different 1997 automobiles. (a)Plot the points from the table
i need answer!!!!!
The following table shows the engine size and highway gasoline mileage for five different 1997 automobiles.
(a)Plot the points from the table on the axes (gasoline mileage M is the dependent variable) to create a scatterplot. Scale your axes appropriately.
(b)What trend does the scatterplot suggest, and what does this mean in terms of your data?
(c)Calculate the correlation coefficient and regression line. Show all your work. Verify with your calculator.
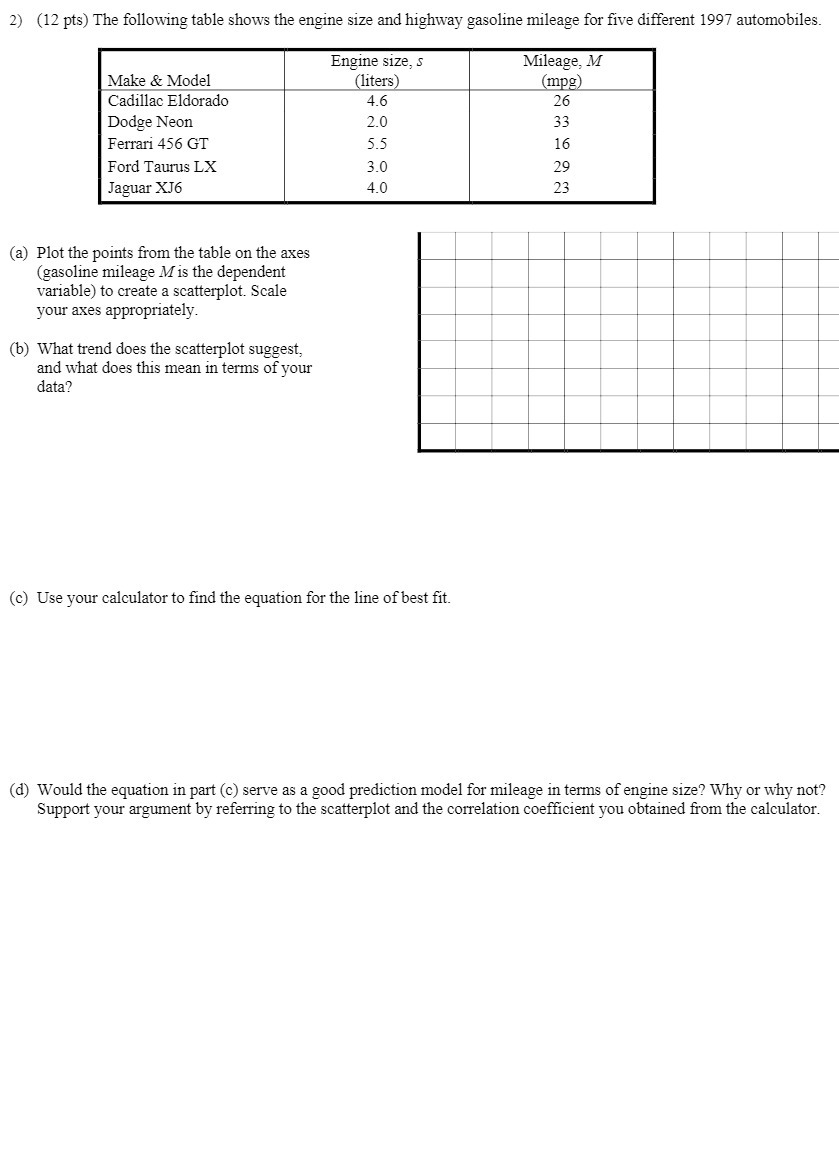
2 ) ( 12 pts ) The following table shows the engine size and highway gasoline mileage for five different 1997 automobiles . Engine size , S Mileage , !` Make & Model ( liters ) Cadillac Eldorado ( InPE ) 4. 6 26 Dodge Neon 2.0 33 Ferrari 4 56 GI 5.5 16 Ford Taurus LX 3.0 29 Jaguar XJ6 4.0 23 ( a ) Plot the points from the table on the axes ( gasoline mileage M is the dependent variable ) to create a scatterplot . Scale You'r axes appropriately . ( b ) What trend does the scatterplot suggest . and what does this mean in terms of your* data ? ( C ) Use your calculator to find the equation for the line of best fit . () Would the equation in part ( C ) serve as a good prediction model for mileage in terms of engine size ? Why or why not ? Support your argument by referring to the scatterplot and the correlation coefficient you obtained from the calculator .*
Step by Step Solution
There are 3 Steps involved in it

Get step-by-step solutions from verified subject matter experts