

Question: 2 22 The model is based on the following: 23 The acquisition was made at the last day of the year. 24 There is no
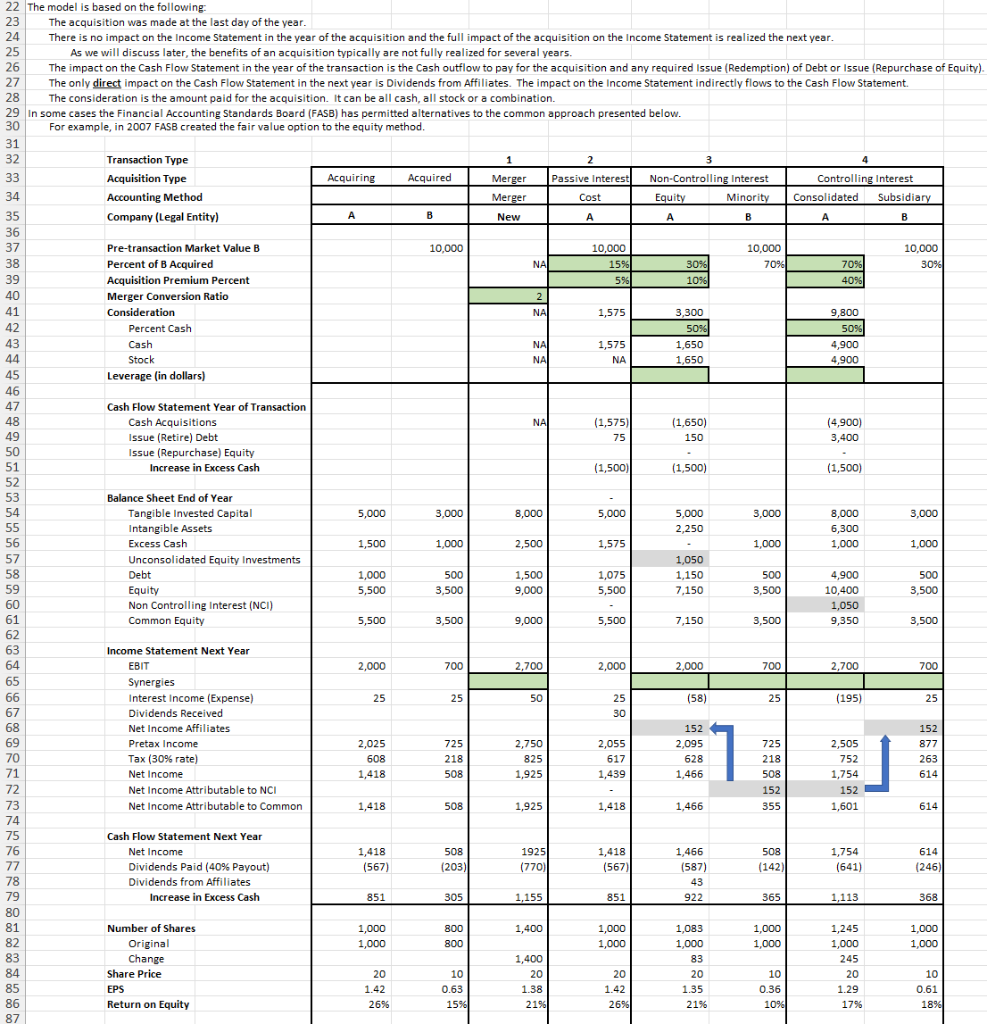
2 22 The model is based on the following: 23 The acquisition was made at the last day of the year. 24 There is no impact on the Income Statement in the year of the acquisition and the full impact of the acquisition on the Income Statement is realized the next year. 25 As we will discuss later, the benefits of an acquisition typically are not fully realized for several years. 26 The impact on the Cash Flow Statement in the year of the transaction is the Cash outflow to pay for the acquisition and any required Issue (Redemption) of Debt or Issue (Repurchase of Equity). 27 The only direct impact on the Cash Flow Statement in the next year is Dividends from Affiliates. The impact on the Income Statement indirectly flows to the Cash Flow Statement. 28 The consideration is the amount paid for the acquisition. It can be all cash, all stock or a combination. 29 In some cases the Financial Accounting Standards Board (FASB) has permitted alternatives to the common approach presented below. 30 For example, in 2007 FASB created the fair value option to the equity method. 31 32 Transaction Type 1 3 33 Acquisition Type Acquiring Acquired Merger Passive Interest Non-Controlling Interest Controlling Interest 34 Accounting Method Merger Cost Equity Minority Consolidated Subsidiary 35 Company (Legal Entity) A B New A A B A B 36 37 Pre-transaction Market Value B 10,000 10,000 10,000 10,000 38 Percent of B Acquired NA 15% 30% 7096 7096 30% 39 Acquisition Premium Percent 5%) 1096 4096 * 40 Merger Conversion Ratio 2 41 41 Consideration NA 1,575 3,300 9,800 42 42 Percent Cash 5096 5096 43 Cash 1,575 1,650 4,900 44 Stock NA NA 1,650 4,900 45 Leverage (in dollars) 46 47 Cash Flow Statement Year of Transaction 48 Cash Acquisitions (1,575) (1,650) (4,900) 49 Issue (Retire) Debt 75 150 3,400 50 Issue (Repurchase) Equity 51 Increase in Excess Cash (1,500) (1,500) 52 (1,500) 53 Balance Sheet End of Year 54 Tangible Invested Capital 5,000 3,000 8,000 5,000 5,000 3,000 8,000 3,000 55 Intangible Assets 2,250 6,300 56 Excess Cash 1,500 1,000 2,500 1,575 1,000 1,000 1,000 57 Unconsolidated Equity Investments 1,050 58 Debt 1,000 500 1,500 1,075 1,150 500 4,900 500 59 Equity 5,500 3,500 9,000 5,500 7,150 3,500 10,400 3,500 60 Non Controlling Interest (NCI) 1,050 61 Common Equity 5,500 3,500 9,000 5,500 7,150 3,500 9,350 62 3,500 63 Income Statement Next Year 64 EBIT 2,000 700 2,700 2,000 2,000 700 2,700 700 65 Synergies 66 Interest Income (Expense) ) 25 25 50 25 (58) 25 (195) 25 67 Dividends Received 30 68 Net Income Affiliates co 152 152 69 Pretax Income 2,025 725 2,750 70 2,055 2,095 725 2,505 877 70 Tax (30% rate) (% 608 218 825 617 628 218 752 263 71 1,418 508 1,925 1,439 1,466 508 1,754 614 72 Net Income Attributable to NCI 152 152 73 Net Income Attributable to common 1,418 508 1,925 1,418 1,466 355 1,601 614 74 75 Cash Flow Statement Next Year 76 Net Income 1,418 508 1925 1,418 508 1,754 614 77 Dividends Paid (40% Payout) (567) (203) (770) (567) (587) (142) (641) (246) 78 Dividends from Affiliates 43 79 Increase in Excess Cash 851 305 1,155 851 922 365 1,113 368 80 81 Number of Shares 1,000 800 1,400 1,000 1,083 1,000 1,245 1,000 82 Original 1,000 800 1,000 1,000 1,000 1,000 83 Change 1,400 83 245 84 Share Price 20 10 20 20 20 10 20 10 85 EPS 1.42 0.63 1.38 1.42 1.35 0.36 1.29 0.61 86 Return on Equity 26% 15% 2196 26% 2196 1096 17% % 87 1896 Net Income 1,466 1,000 2 22 The model is based on the following: 23 The acquisition was made at the last day of the year. 24 There is no impact on the Income Statement in the year of the acquisition and the full impact of the acquisition on the Income Statement is realized the next year. 25 As we will discuss later, the benefits of an acquisition typically are not fully realized for several years. 26 The impact on the Cash Flow Statement in the year of the transaction is the Cash outflow to pay for the acquisition and any required Issue (Redemption) of Debt or Issue (Repurchase of Equity). 27 The only direct impact on the Cash Flow Statement in the next year is Dividends from Affiliates. The impact on the Income Statement indirectly flows to the Cash Flow Statement. 28 The consideration is the amount paid for the acquisition. It can be all cash, all stock or a combination. 29 In some cases the Financial Accounting Standards Board (FASB) has permitted alternatives to the common approach presented below. 30 For example, in 2007 FASB created the fair value option to the equity method. 31 32 Transaction Type 1 3 33 Acquisition Type Acquiring Acquired Merger Passive Interest Non-Controlling Interest Controlling Interest 34 Accounting Method Merger Cost Equity Minority Consolidated Subsidiary 35 Company (Legal Entity) A B New A A B A B 36 37 Pre-transaction Market Value B 10,000 10,000 10,000 10,000 38 Percent of B Acquired NA 15% 30% 7096 7096 30% 39 Acquisition Premium Percent 5%) 1096 4096 * 40 Merger Conversion Ratio 2 41 41 Consideration NA 1,575 3,300 9,800 42 42 Percent Cash 5096 5096 43 Cash 1,575 1,650 4,900 44 Stock NA NA 1,650 4,900 45 Leverage (in dollars) 46 47 Cash Flow Statement Year of Transaction 48 Cash Acquisitions (1,575) (1,650) (4,900) 49 Issue (Retire) Debt 75 150 3,400 50 Issue (Repurchase) Equity 51 Increase in Excess Cash (1,500) (1,500) 52 (1,500) 53 Balance Sheet End of Year 54 Tangible Invested Capital 5,000 3,000 8,000 5,000 5,000 3,000 8,000 3,000 55 Intangible Assets 2,250 6,300 56 Excess Cash 1,500 1,000 2,500 1,575 1,000 1,000 1,000 57 Unconsolidated Equity Investments 1,050 58 Debt 1,000 500 1,500 1,075 1,150 500 4,900 500 59 Equity 5,500 3,500 9,000 5,500 7,150 3,500 10,400 3,500 60 Non Controlling Interest (NCI) 1,050 61 Common Equity 5,500 3,500 9,000 5,500 7,150 3,500 9,350 62 3,500 63 Income Statement Next Year 64 EBIT 2,000 700 2,700 2,000 2,000 700 2,700 700 65 Synergies 66 Interest Income (Expense) ) 25 25 50 25 (58) 25 (195) 25 67 Dividends Received 30 68 Net Income Affiliates co 152 152 69 Pretax Income 2,025 725 2,750 70 2,055 2,095 725 2,505 877 70 Tax (30% rate) (% 608 218 825 617 628 218 752 263 71 1,418 508 1,925 1,439 1,466 508 1,754 614 72 Net Income Attributable to NCI 152 152 73 Net Income Attributable to common 1,418 508 1,925 1,418 1,466 355 1,601 614 74 75 Cash Flow Statement Next Year 76 Net Income 1,418 508 1925 1,418 508 1,754 614 77 Dividends Paid (40% Payout) (567) (203) (770) (567) (587) (142) (641) (246) 78 Dividends from Affiliates 43 79 Increase in Excess Cash 851 305 1,155 851 922 365 1,113 368 80 81 Number of Shares 1,000 800 1,400 1,000 1,083 1,000 1,245 1,000 82 Original 1,000 800 1,000 1,000 1,000 1,000 83 Change 1,400 83 245 84 Share Price 20 10 20 20 20 10 20 10 85 EPS 1.42 0.63 1.38 1.42 1.35 0.36 1.29 0.61 86 Return on Equity 26% 15% 2196 26% 2196 1096 17% % 87 1896 Net Income 1,466 1,000
Step by Step Solution
There are 3 Steps involved in it

Get step-by-step solutions from verified subject matter experts