

Question: 2. (25 points) Suppose we have the climate data for Atlanta in the following table. Climate data for Atlanta Month Temperature( Jan Feb Mar Apr
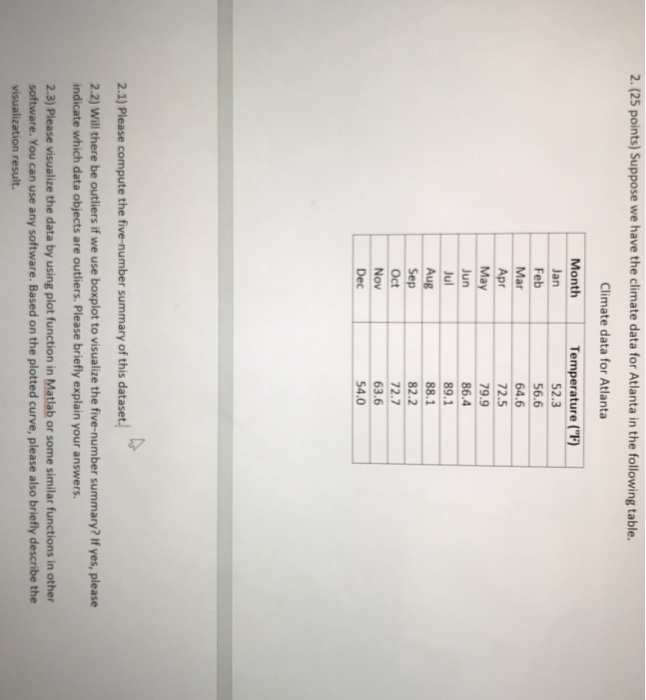
2. (25 points) Suppose we have the climate data for Atlanta in the following table. Climate data for Atlanta Month Temperature( Jan Feb Mar Apr May Jun Jul Aug Sep 52.3 56.6 64.6 72.5 79.9 86.4 89.1 88.1 82.2 72.7 63.6 54.0 Nov 2.1) Please compute the five-number summary of this dataset. 2.2) Will there be outliers if we use boxplot to visualize the five-number summary? If yes, please indicate which data objects are outliers. Please briefly explain your answers 2.3) Please visualize the data by using plot function in Matlab or some similar functions in other software. You can use any software. Based on the plotted curve, please also briefly describe the visualization result
Step by Step Solution
There are 3 Steps involved in it

Get step-by-step solutions from verified subject matter experts