

Question: 2. [25 points] The worksheet Q2 in Assignment 5 Data.xlsx gives the duration of each eruption (in minutes) and the time between eruptions of the
![2. [25 points] The worksheet Q2 in Assignment 5 Data.xlsx gives](https://dsd5zvtm8ll6.cloudfront.net/si.experts.images/questions/2024/10/671d325acf335_682671d325a6f92f.jpg)
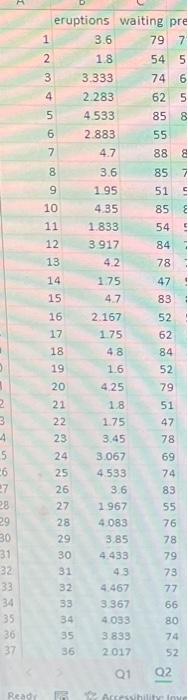
2. [25 points] The worksheet Q2 in Assignment 5 Dataxisx gives the duration of each eruption (in minutes) and the time between eruptions of the Old Faithful Geyser in Yellowstone National Park. a. Conduct a regression analysis. Are the duration and time between eruptions related to each other? Explain using the parameters in the regression analysis. b. Interpret se (standard error) and R2 (r-squared) for these data. What do these values mean? c. Suppose it has been forty minutes since the last eruption. What is the expected duration of the next eruption? d. Using the standard error, calculate the 95% upper and lower limits of the next eruption. (Note: Lower limit = Forecast -2 * Standard error; Upper limit = Forecast +2 Standard error) eruptions waiting pre \begin{tabular}{|c|c|c|} \hline 1 & 3.6 & 79 \\ \hline 2 & 1.8 & 54 \\ \hline 3 & 3.333 & 74 \\ \hline 4 & 2.283 & 62 \\ \hline 5 & 4.533 & 85 \\ \hline 6 & 2.883 & 55 \\ \hline 7 & 4.7 & 88 \\ \hline 8 & 3.6 & 85 \\ \hline 9 & 195 & 51 \\ \hline 10 & 4.35 & 85 \\ \hline 11 & 1.833 & 54 \\ \hline 12 & 3917 & 84 \\ \hline 13 & 4.2 & 78 \\ \hline 14 & 175 & 47 \\ \hline 15 & 47 & 83 \\ \hline 16 & 2.167 & 52 \\ \hline 17 & 1.75 & 62 \\ \hline 18 & 48 & 84 \\ \hline 19 & 1.6 & 52 \\ \hline 20 & 4.25 & 79 \\ \hline 21 & 18 & 51 \\ \hline 22 & 1.75 & 47 \\ \hline 23 & 3.45 & 78 \\ \hline 24 & 3.067 & 69 \\ \hline 25 & 4533 & 74 \\ \hline 26 & 3.6 & 83 \\ \hline 27 & 1967 & 55 \\ \hline 28 & 4.083 & 76 \\ \hline 29 & 3.85 & 78 \\ \hline 30 & 4.433 & 79 \\ \hline 31 & 43 & 73 \\ \hline 32 & 4.467 & 77 \\ \hline 33 & 3.367 & 66 \\ \hline 34 & 4.033 & 80 \\ \hline 35 & 3.833 & 74 \\ \hline 36 & 2017 & 52 \\ \hline 3 & Q1 & Q2 \\ \hline \end{tabular}
Step by Step Solution
There are 3 Steps involved in it

Get step-by-step solutions from verified subject matter experts