

Question: 2. (25%) Using the information in table one, calculate the following performance measures for portfolio P and the market: The Sharpe ratio, Jensen's alpha, Treynor
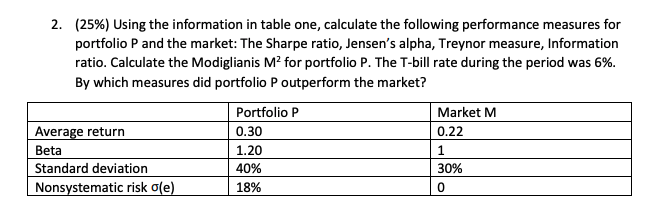
2. (25%) Using the information in table one, calculate the following performance measures for portfolio P and the market: The Sharpe ratio, Jensen's alpha, Treynor measure, Information ratio. Calculate the Modiglianis M2 for portfolio P. The T-bill rate during the period was 6%. By which measures did portfolio P outperform the market? Market M 0.22 Average return Beta Standard deviation Nonsystematic risk ole) Portfolio P 0.30 1.20 40% 18% 30%
Step by Step Solution
There are 3 Steps involved in it
1 Expert Approved Answer
Step: 1 Unlock

Question Has Been Solved by an Expert!
Get step-by-step solutions from verified subject matter experts
Step: 2 Unlock
Step: 3 Unlock