

Question: 2. (25%) Write a Python / Matlab program to perform the Project 11.2 given in Chapter 11 (see Page 602 of 3rd Edition or Page
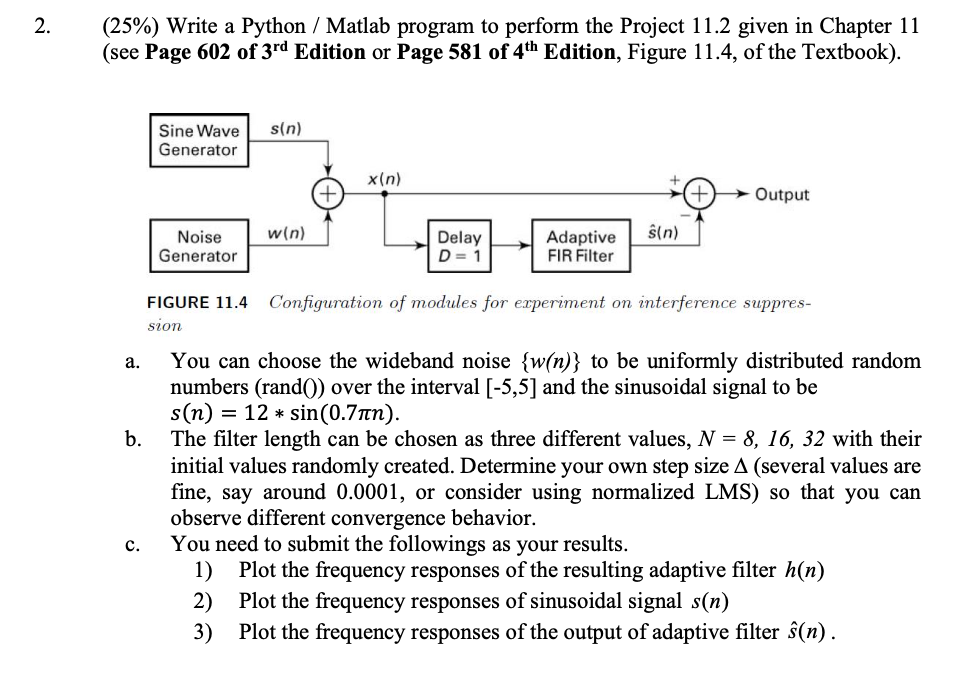
2. (25%) Write a Python / Matlab program to perform the Project 11.2 given in Chapter 11 (see Page 602 of 3rd Edition or Page 581 of 4th Edition, Figure 11.4, of the Textbook). s(n) Sine Wave Generator x(n) * Output w(n) in) Noise Generator Delay D = 1 Adaptive FIR Filter FIGURE 11.4 Configuration of modules for experiment on interference suppres- szon a. b. You can choose the wideband noise {w(n)} to be uniformly distributed random numbers (rand() over the interval [-5,5] and the sinusoidal signal to be s(n) = 12 * sin(0.7in). The filter length can be chosen as three different values, N = 8, 16, 32 with their initial values randomly created. Determine your own step size A (several values are fine, say around 0.0001, or consider using normalized LMS) so that you can observe different convergence behavior. You need to submit the followings as your results. 1) Plot the frequency responses of the resulting adaptive filter h(n) 2) Plot the frequency responses of sinusoidal signal s(n) 3) Plot the frequency responses of the output of adaptive filter (n). c. 4) Plot e(n) from n = 0 to the convergence. # For frequency responses, you are asked to plot both Magnitude response in dB and Phase response in unit of t. 2. (25%) Write a Python / Matlab program to perform the Project 11.2 given in Chapter 11 (see Page 602 of 3rd Edition or Page 581 of 4th Edition, Figure 11.4, of the Textbook). s(n) Sine Wave Generator x(n) * Output w(n) in) Noise Generator Delay D = 1 Adaptive FIR Filter FIGURE 11.4 Configuration of modules for experiment on interference suppres- szon a. b. You can choose the wideband noise {w(n)} to be uniformly distributed random numbers (rand() over the interval [-5,5] and the sinusoidal signal to be s(n) = 12 * sin(0.7in). The filter length can be chosen as three different values, N = 8, 16, 32 with their initial values randomly created. Determine your own step size A (several values are fine, say around 0.0001, or consider using normalized LMS) so that you can observe different convergence behavior. You need to submit the followings as your results. 1) Plot the frequency responses of the resulting adaptive filter h(n) 2) Plot the frequency responses of sinusoidal signal s(n) 3) Plot the frequency responses of the output of adaptive filter (n). c. 4) Plot e(n) from n = 0 to the convergence. # For frequency responses, you are asked to plot both Magnitude response in dB and Phase response in unit of t
Step by Step Solution
There are 3 Steps involved in it

Get step-by-step solutions from verified subject matter experts