

Question: 2. 3. 0 4 O Week Refer to the gasoline sales time series data in the given table. Sales (1,000s of gallons) 1 18
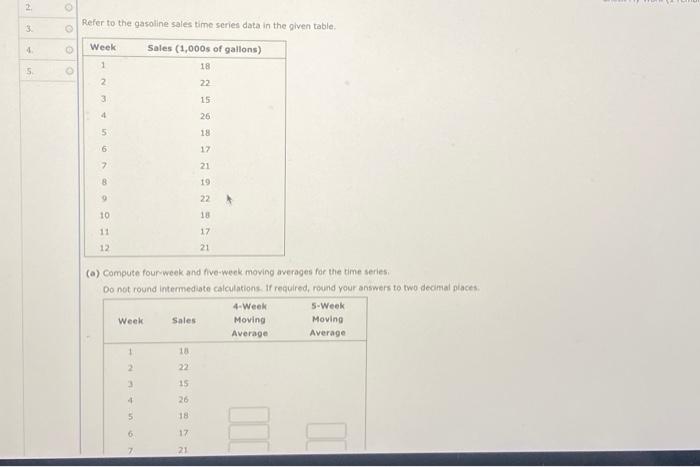
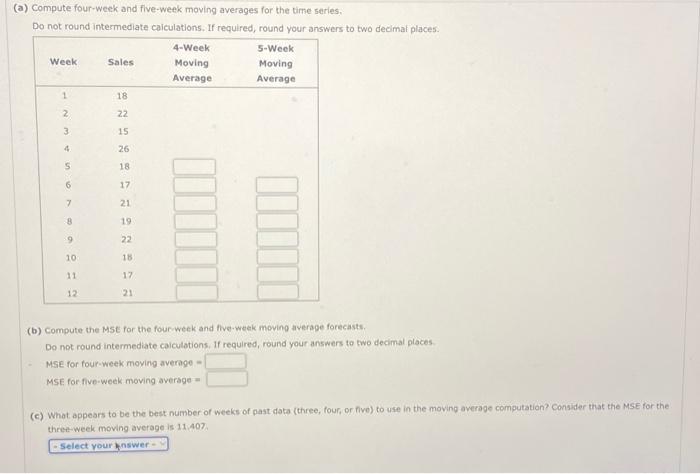
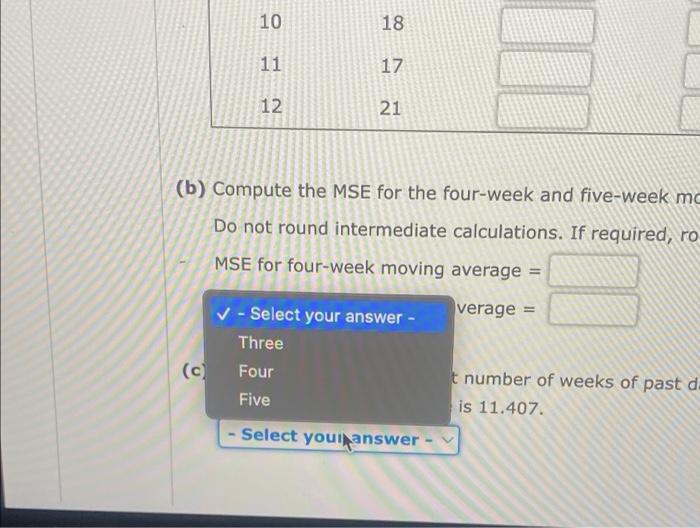
2. 3. 0 4 O Week Refer to the gasoline sales time series data in the given table. Sales (1,000s of gallons) 1 18 5. 0 2 22 3 15 4 26 5 18 6 17 7 21 8 19 22 10 18 11 17 12 21 (a) Compute four-week and five-week moving averages for the time series. Do not round intermediate calculations. If required, round your answers to two decimal places. 4-Week 5-Week Week Sales Moving Moving Average Average 18 2 22 3 15 4 26 5 18 6. 17 7 21
Step by Step Solution
There are 3 Steps involved in it
1 Expert Approved Answer
Step: 1 Unlock

Question Has Been Solved by an Expert!
Get step-by-step solutions from verified subject matter experts
Step: 2 Unlock
Step: 3 Unlock