

Question: 2 3 / 2 3 8 2 3 9 2 4 0 2 4 1 2 4 2 2 4 3 2 4 4 2
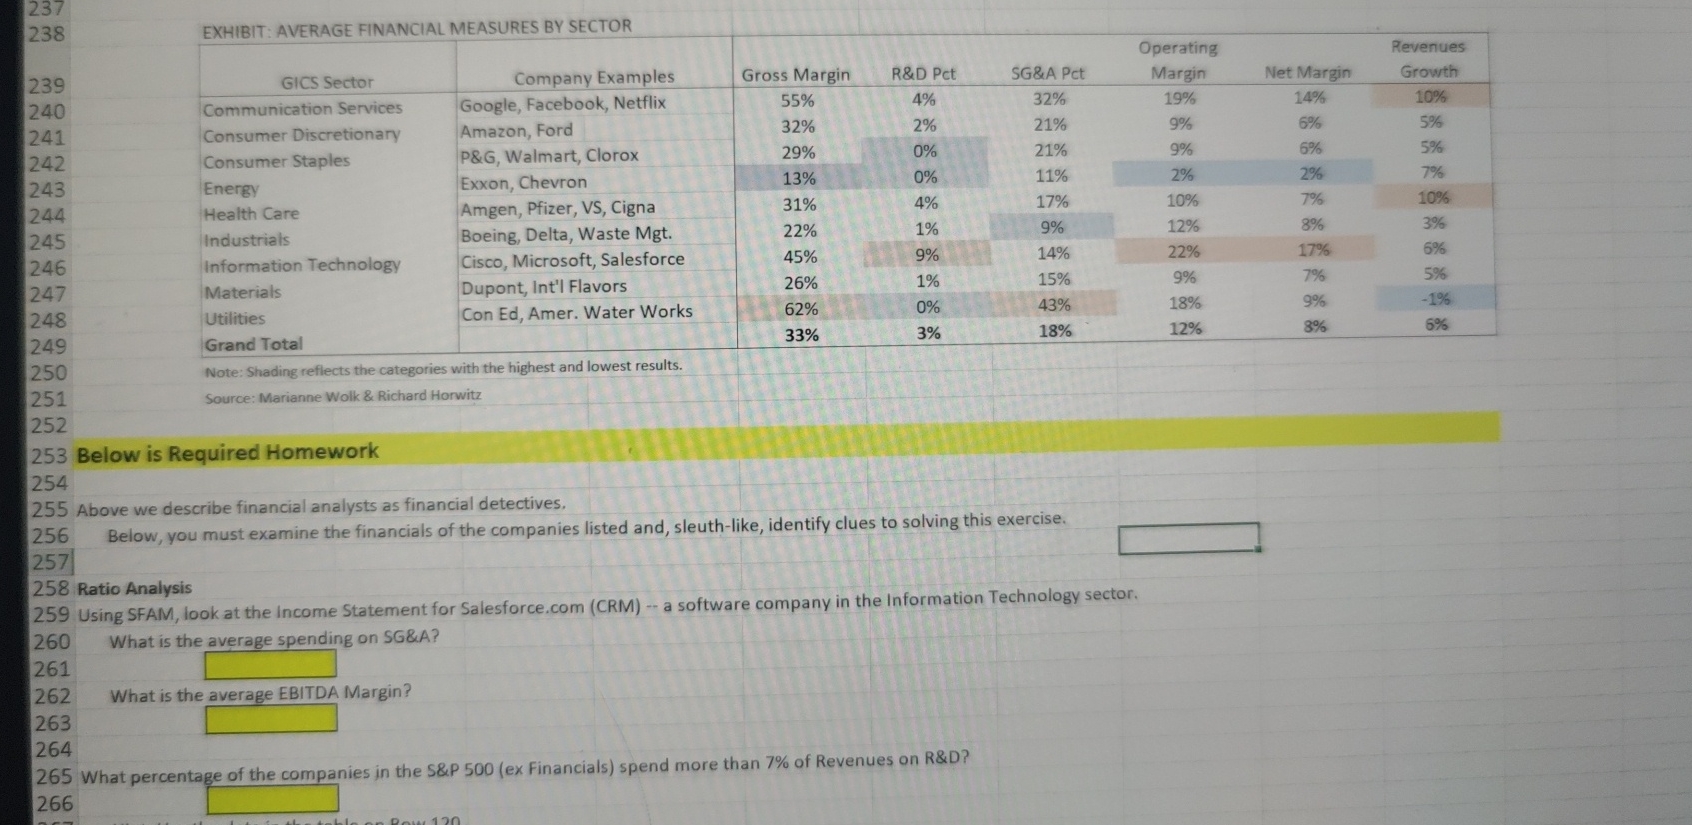
EXHIBIT: AVERAGE FINANCIAL MEASURES BY SECTORGICS SectorCommunication ServicesConsumer DiscretionaryConsumer Staples Below is Required HomeworkEnergyHealth Care Ratio AnalysisIndustrialsInformation Technology Above we describe financial analysts as financial detectives.MaterialsUtilitiesGrand TotalNote: Shading reflects the categories with the highest and lowest results.Company ExamplesGoogle, Facebook, NetflixAmazon, FordP&G Walmart, CloroxExxon, ChevronAmgen, Pfizer, VS CignaBoeing, Delta, Waste MgtSource: Marianne Wolk & Richard HorwitzCisco, Microsoft, SalesforceDupont, Int'l FlavorsCon Ed Amer. Water WorksWhat is the average spending on SG&AWhat is the average EBITDA Margin?Gross MarginHint: Use the data in the table on Row R&D Pct What percentage of the comnpanies in the S&P ex Financials spend more than of Revenues on R&DSG&A Pct Using SFAM, look at the Income Statement for Salesforce.com CRM a software company in the Information Technology sectorBelow, you must examine the financials of the companies listed and, sleuthlike, identify clues to solving this exerciseOperatingMarginNet MarginRevenuesGrowth
inancial Position: Income Statement
elow we show a different histogram which counts the number of companies in the S&P ex financials in each margin interval.
Ne show the percentage of companies in each bucket, rather than the number in each margin category.
For example, this EXHIBIT shows that the lion's share of companies report Gross Margins of
EXHIBIT: AVERAGE MARGINS FOR THE S&P EX FINANCIALS
III
Note: Shading reflects the categories capturing most of companies.
Source: Marianne Wolk & Richard Horwitz
Below is Required Homework
Above we describe financial analysts as financial detectives.
Below, you must examine the financials of the companies listed and, sleuthlike, identify clues to solving this exercise.
Ratio Analysis
Using SFAM, look at the income Statement for
Salesforce.com CRM a software company in the Information Technology sector.
What is the average spending on SG&A
What is the average EBITDA Margin?
What percentage of the companies in the S&P ex Financials spend more than of Revenues on R&D
Step by Step Solution
There are 3 Steps involved in it
1 Expert Approved Answer
Step: 1 Unlock

Question Has Been Solved by an Expert!
Get step-by-step solutions from verified subject matter experts
Step: 2 Unlock
Step: 3 Unlock