

Question: 2 3 Presented below is the data detailing the annual sales and the number of customers for 14 different stores Number of Customers in
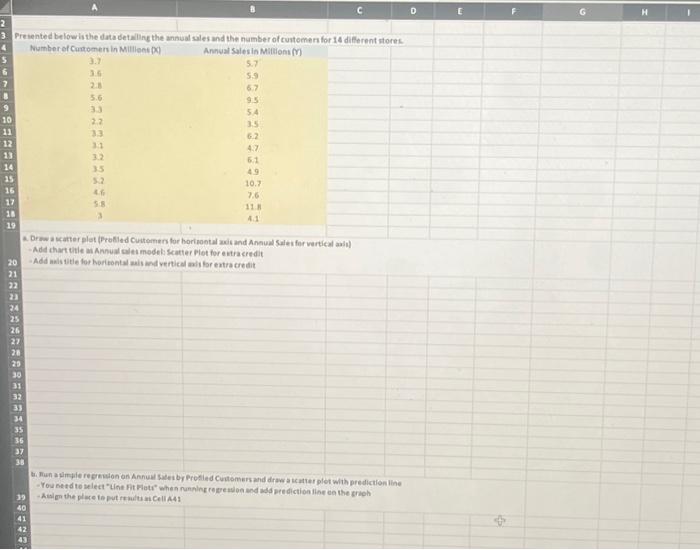
2 3 Presented below is the data detailing the annual sales and the number of customers for 14 different stores Number of Customers in Millions D Annual Sales in Millions (Y) 3.7 5.7 3.6 5.9 2.8 6.7 5.6 9.5 3.3 5.4 2.2 3.5 3.3 6.2 31 4.7 13 3.2 6.1 14 35 4.9 15 5.2 10.7 16 4.6 7.6 17 18 58 3 11.8 4.1 19 Draw a scatter plot (Profiled Customers for horizontal axis and Annual Sales for vertical axis) -Add chart title as Annual sales model: Scatter Plot for extra credit 20 Add axis title for horisontal axis and vertical axis for extra credit 21 22 23 24 25 26 27 28 29 30 31 32 33 34 35 36 37 38 39 40 41 42 43 Run a simple regression on Annual Sales by Profiled Customers and draw a scatter plot with prediction line -You need to select "Line Fit Plots" when running regression and add prediction line on the graphi -Assign the place to put results as Cell A41 D E F H 110 113 L : 130 130 10 112 117 121 Os hypothed for the officiant wing 1 tart with the claim that share it and the of paid if that of 123 e 124 Myporhe 126 pe 127 Des 114 116 AND 144 147 765 Test
Step by Step Solution
There are 3 Steps involved in it

Get step-by-step solutions from verified subject matter experts