

Question: 2 . 3 . Table Q 2 . 3 presents the results of the sieve analysis conducted on asphalt mixes ( Sample 1 and Sample
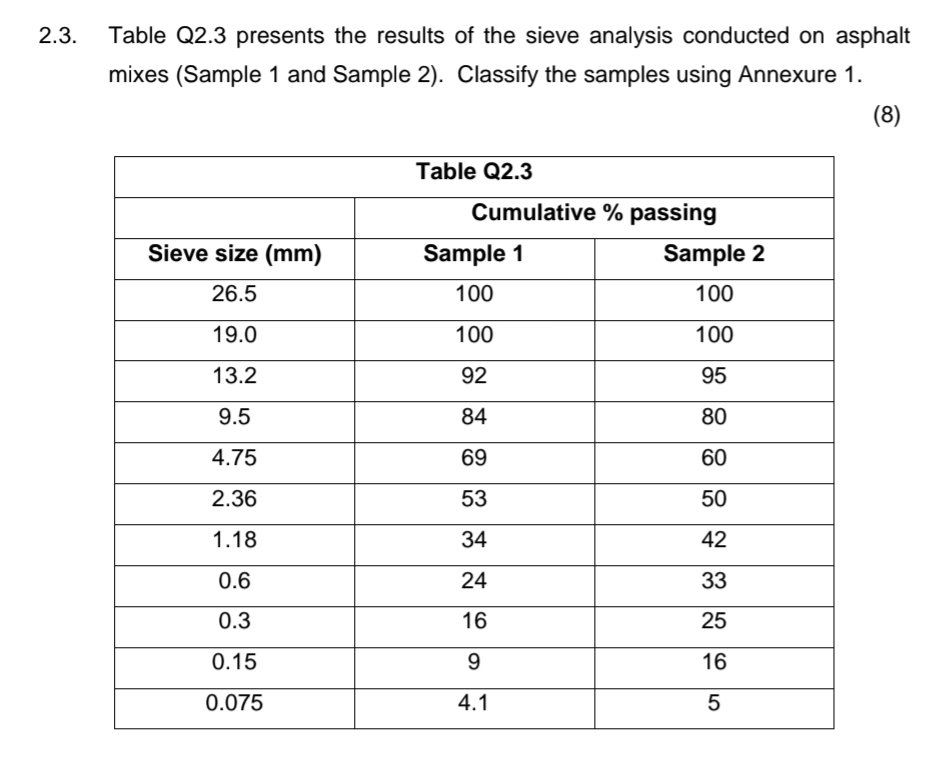
Table Q presents the results of the sieve analysis conducted on asphalt mixes Sample and Sample Classify the samples using Annexure
tableTable QCumulative passingSieve size mmSample Sample
Step by Step Solution
There are 3 Steps involved in it
1 Expert Approved Answer
Step: 1 Unlock

Question Has Been Solved by an Expert!
Get step-by-step solutions from verified subject matter experts
Step: 2 Unlock
Step: 3 Unlock