

Question: 2. 3 Year 1 2 3 4 5 Sales 150 155 161 160 164 165 169 170 172 175 Promotions 28 32 37 43 50
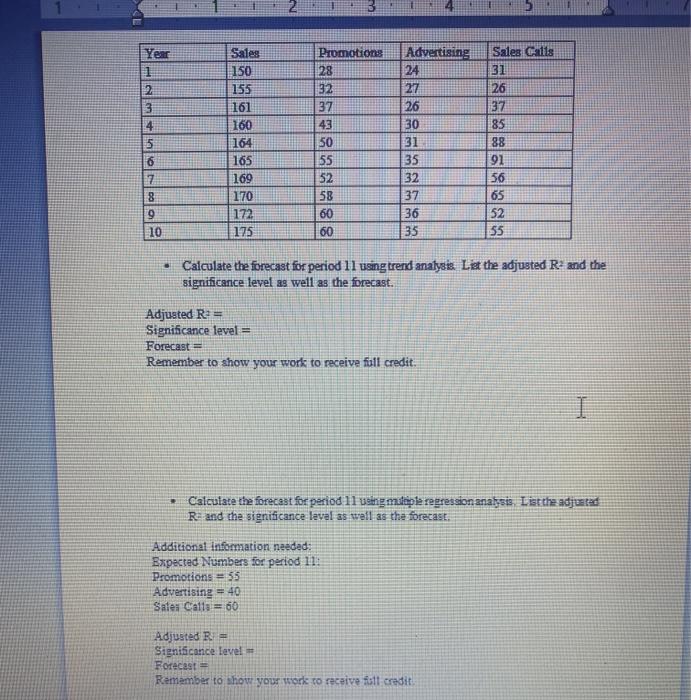
2. 3 Year 1 2 3 4 5 Sales 150 155 161 160 164 165 169 170 172 175 Promotions 28 32 37 43 50 55 52 58 60 60 Advertising 24 27 26 30 31 35 32 37 36 Sales Cats 31 26 37 85 88 91 56 65 52 55 6 7 8 9 10 Calculate the forecast for period 11 using trend analysis. Liet the adjusted R2 and the significance level as well as the forecast. Adjusted R3 = Significance level = Forecast = Remember to show your work to receive full credit. Calculate the forecast for period 11 using maple regression analysis. List the adjusted Rand the significance level as well as the forecast. Additional Information needed: Expected Numbers for period 11: Promotions = 55 Advertising = 40 Sales Calls = 60 Adjusted Significance level Forecast Remember to show your work to receive filt credit 2. 3 Year 1 2 3 4 5 Sales 150 155 161 160 164 165 169 170 172 175 Promotions 28 32 37 43 50 55 52 58 60 60 Advertising 24 27 26 30 31 35 32 37 36 Sales Cats 31 26 37 85 88 91 56 65 52 55 6 7 8 9 10 Calculate the forecast for period 11 using trend analysis. Liet the adjusted R2 and the significance level as well as the forecast. Adjusted R3 = Significance level = Forecast = Remember to show your work to receive full credit. Calculate the forecast for period 11 using maple regression analysis. List the adjusted Rand the significance level as well as the forecast. Additional Information needed: Expected Numbers for period 11: Promotions = 55 Advertising = 40 Sales Calls = 60 Adjusted Significance level Forecast Remember to show your work to receive filt credit
Step by Step Solution
There are 3 Steps involved in it

Get step-by-step solutions from verified subject matter experts