

Question: 2. (35 Points) Examine the provided data. We are working with a restaurant to improve service tims. We have collected data on server times
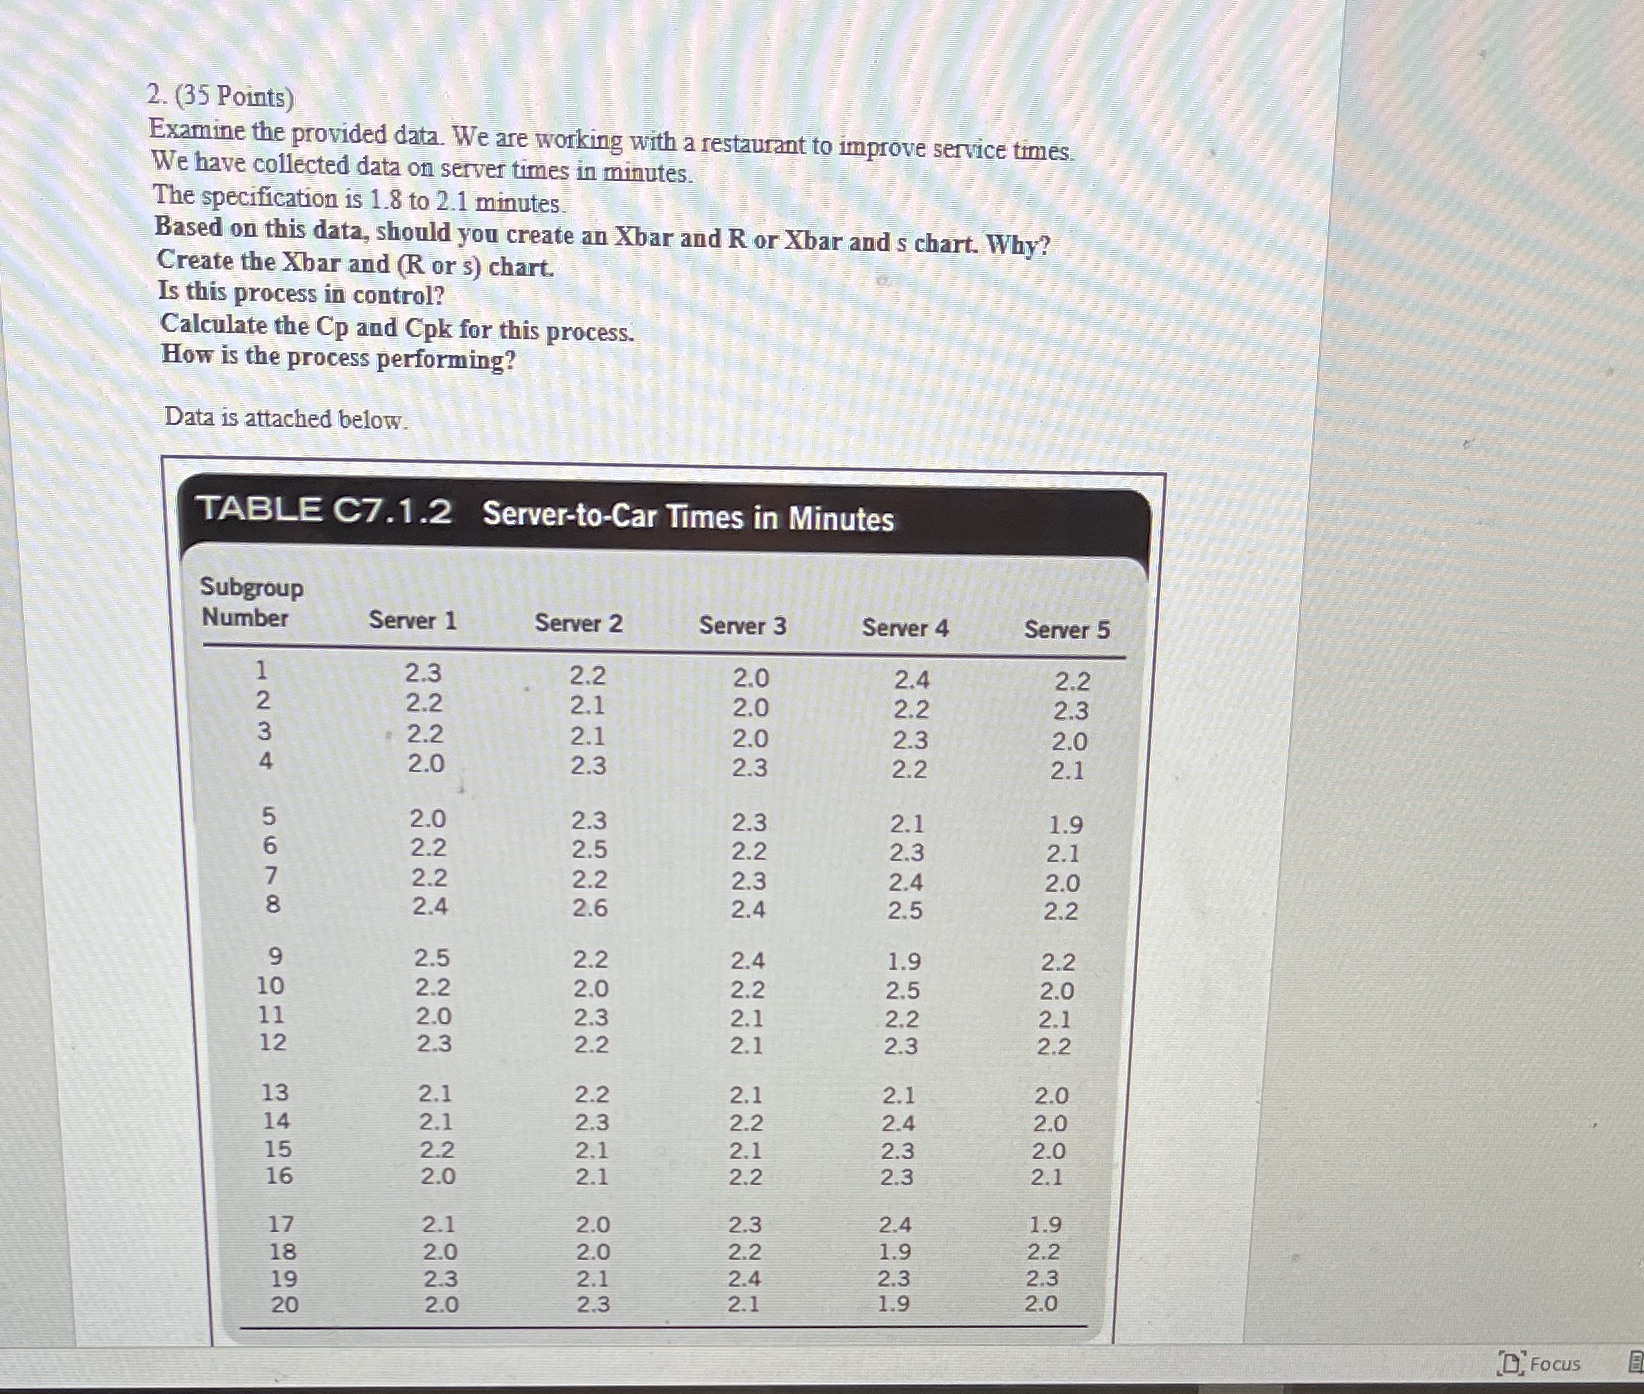
2. (35 Points) Examine the provided data. We are working with a restaurant to improve service tims. We have collected data on server times in minutes. The specification is 1.8 to 2.1 minutes. Based on this data, should you create an Xbar and R or Xbar and s chart. Why? Create the Xbar and (R or s) chart. Is this process in control? Calculate the Cp and Cpk for this process. How is the process performing? Data is attached below. TABLE C7.1.2 Server-to-Car Times in Minutes Subgroup Number Server 1 Server 2 Server 3 Server 4 Server 5 1234 6698 2.3 2.2 2.0 2.4 2.2 2.2 2.1 2.0 2.2 2.3 2.2 2.1 2.0 2.3 2.0 2.0 2.3 2.3 2.2 2.1 2.0 2.3 2.3 2.1 1.9 2.2 2.5 2.2 2.3 2.1 2.2 2.2 2.3 2.4 2.0 2.4 2.6 2.4 2.5 2.2 9 2.5 2.2 2.4 1.9 2.2 10 2.2 2.0 2.2 2.5 2.0 11 2.0 2.3 2.1 2.2 2.1 12 2.3 2.2 2.1 2.3 2.2 13 2.1 2.2 2.1 2.1 2.0 14 2.1 2.3 2.2 2.4 2.0 15 2.2 2.1 2.1 2.3 2.0 16 2.0 2.1 2.2 2.3 2.1 17 2.1 2.0 2.3 2.4 1.9 18 2.0 2.0 2.2 1.9 2.2 19 2.3 2.1 2.4 2.3 2.3 20 2.0 2.3 2.1 1.9 2.0 Focus B
Step by Step Solution
There are 3 Steps involved in it

Get step-by-step solutions from verified subject matter experts