

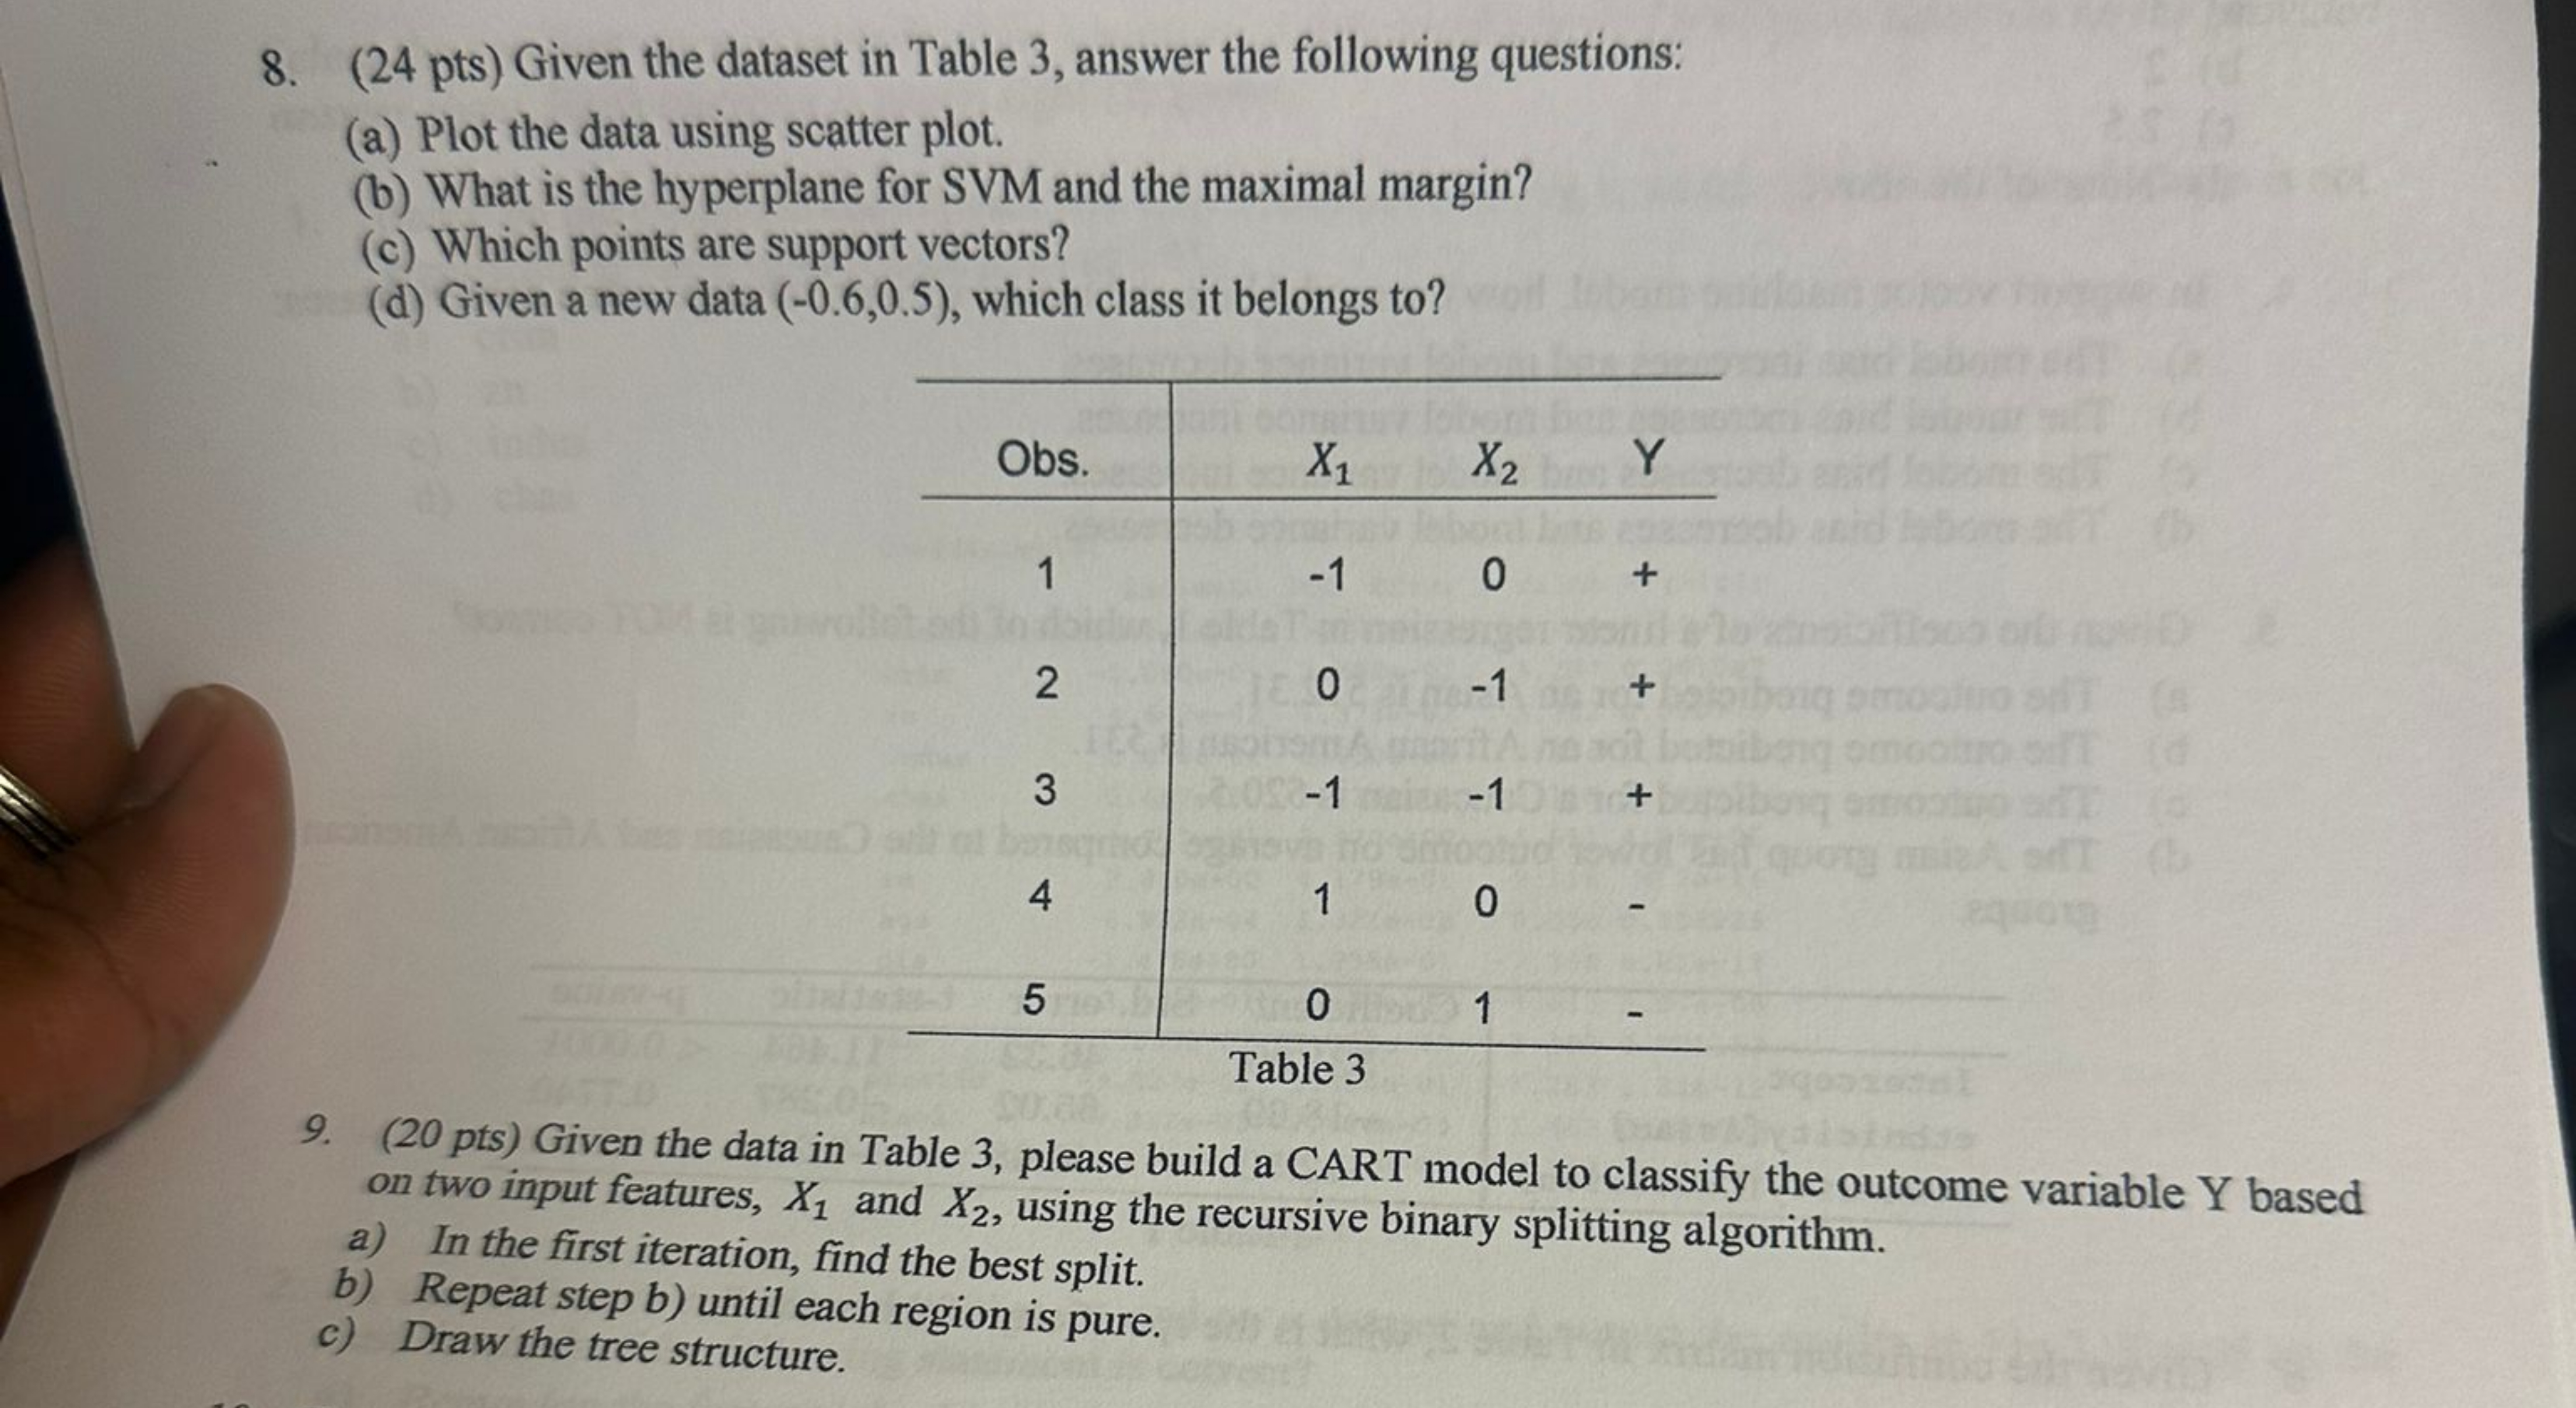
Question: ( 2 4 pts ) Given the dataset in Table 3 , answer the following questions: ( a ) Plot the data using scatter plot.
pts Given the dataset in Table answer the following questions:
a Plot the data using scatter plot.
b What is the hyperplane for SVM and the maximal margin?
c Which points are support vectors?
d Given a new data which class it belongs to
Obs.
X
Y
Table
X
pts Given the data in Table please build a CART model to classify the outcome variable Y based on two input features, X and X using the recursive binary splitting algorithm.
a In the first iteration, find the best split.
b Repeat step b until each region is pure.
c Draw the tree structure pts Given the dataset in Table answer the following questions:
a Plot the data using scatter plot.
b What is the hyperplane for SVM and the maximal margin?
c Which points are support vectors?
d Given a new data which class it belongs to
pts Given the data in Table please build a CART model to classify the outcome variable based
on two input features, and using the recursive binary splitting algorithm.
a In the first iteration, find the best split.
b Repeat step b until each region is pure.
c Draw the tree structure.
Step by Step Solution
There are 3 Steps involved in it
1 Expert Approved Answer
Step: 1 Unlock

Question Has Been Solved by an Expert!
Get step-by-step solutions from verified subject matter experts
Step: 2 Unlock
Step: 3 Unlock