

Question: 2. (4pts) Consider the following bar chart, which represents the relative frequencies of travel class ticket purchases for an airline: 0.6 - 0.4- Relative Frequency
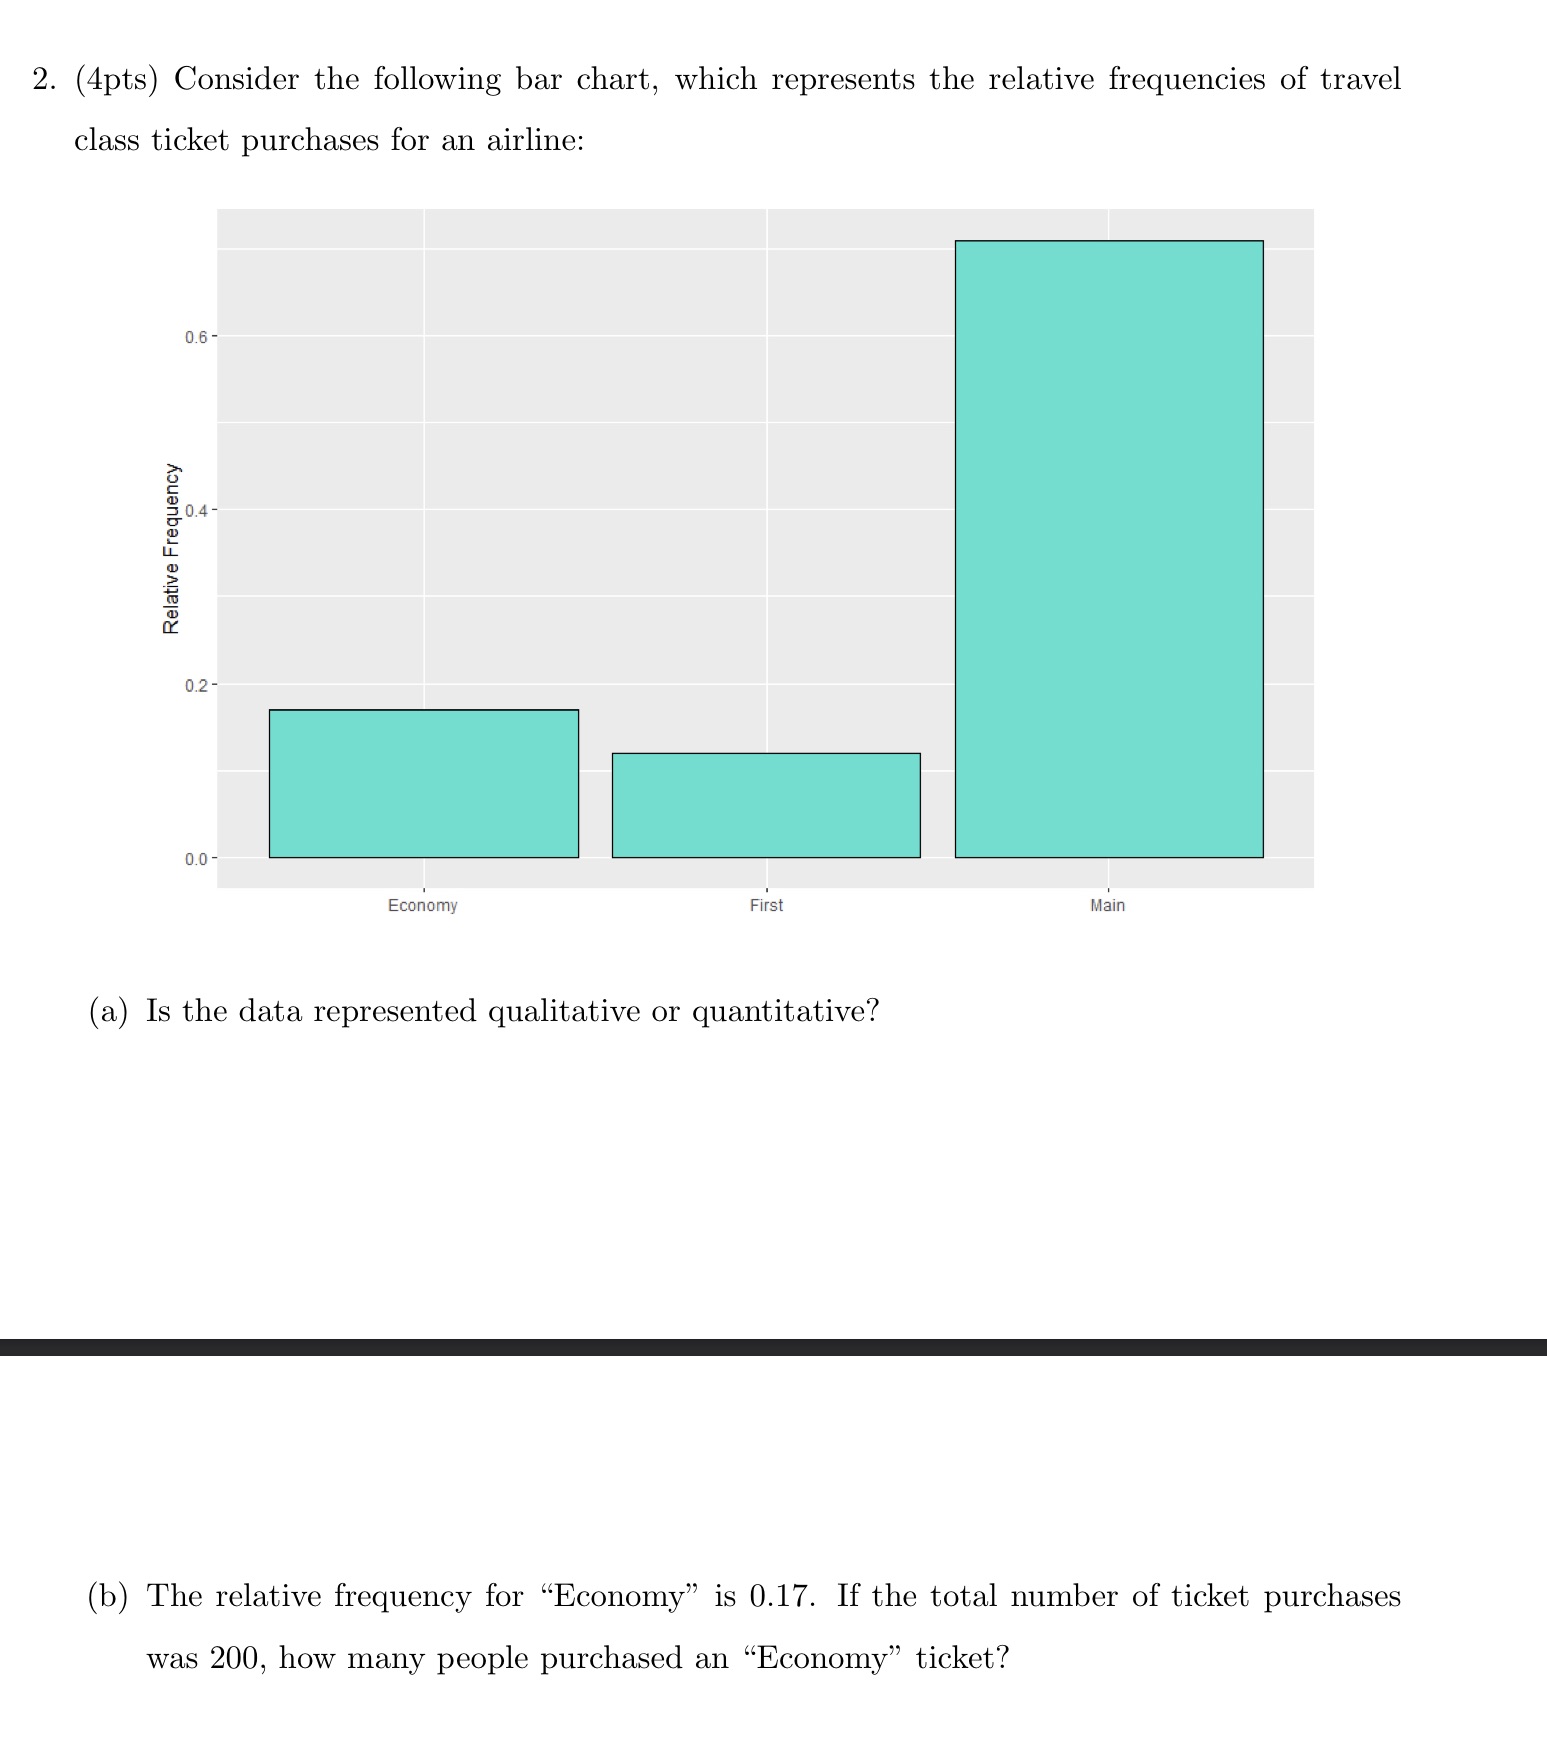
2. (4pts) Consider the following bar chart, which represents the relative frequencies of travel class ticket purchases for an airline: 0.6 - 0.4- Relative Frequency 0.2- 0.0 Economy First Main (a) Is the data represented qualitative or quantitative? (b) The relative frequency for "Economy" is 0.17. If the total number of ticket purchases was 200, how many people purchased an "Economy" ticket
Step by Step Solution
There are 3 Steps involved in it
1 Expert Approved Answer
Step: 1 Unlock

Question Has Been Solved by an Expert!
Get step-by-step solutions from verified subject matter experts
Step: 2 Unlock
Step: 3 Unlock