

Question: 2. (60 points) A small factory has two production lines (i.e., PL1 and PL2) and two repairmen (i.e., Repairman A and Repairman A). PL 1
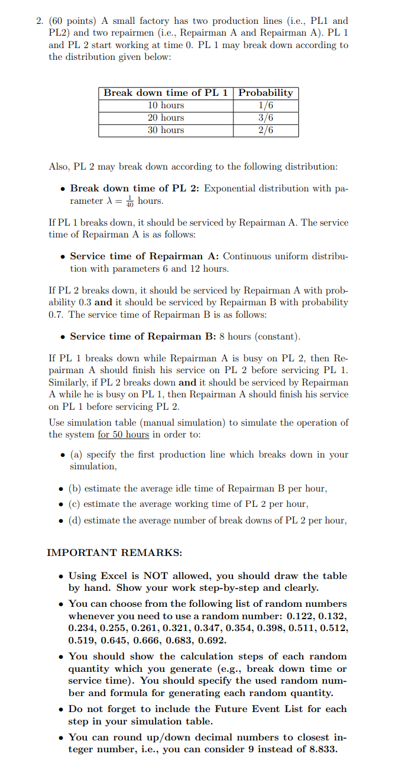
2. (60 points) A small factory has two production lines (i.e., PL1 and PL2) and two repairmen (i.e., Repairman A and Repairman A). PL 1 and PL 2 start working at time 0. PL 1 may break down according to the distribution given below: Break down time of PL 1 Probability 10 hours 1/6 20 hours 3/6 30 hours 2/6 Also, PL 2 may break down according to the following distribution: Break down time of PL 2: Exponential distribution with pa- rameter 1 hours. If PL 1 breaks down, it should be serviced by Repairman A. The service time of Repairman A is as follows: Service time of Repairman A: Continuous uniform distribu- tion with parameters 6 and 12 hours. If PL 2 breaks down, it should be serviced by Repairman A with prob- ability 0.3 and it should be serviced by Repairman B with probability 0.7. The service time of Repairman B is as follows: Service time of Repairman B: 8 hours (constant). If PL 1 breaks down while Repairman A is busy on PL 2, then Re- pairman A should finish his service on PL 2 before servicing PL 1. Similarly, if PL 2 breaks down and it should be serviced by Repairman A while he is busy on PL 1, then Repairman A should finish his service on PL 1 before servicing PL 2. Use simulation table (manual simulation) to simulate the operation of the system for 50 hours in order to: (a) specify the first production line which breaks down in your simulation, (b) estimate the average idle time of Repairman B per hour, (c) estimate the average working time of PL 2 per hour, (d) estimate the average number of break downs of PL 2 per hour, IMPORTANT REMARKS: . Using Excel is NOT allowed, you should draw the table by hand. Show your work step-by-step and clearly. You can choose from the following list of random numbers whenever you need to use a random number: 0.122, 0.132, 0.234, 0.255, 0.261, 0.321, 0.347, 0.354, 0.398, 0.511, 0.512, 0.519, 0.645, 0.666, 0.683, 0.692. . You should show the calculation steps of each random quantity which you generate (e.g., break down time or service time). You should specify the used random num- ber and formula for generating each random quantity. Do not forget to include the Future Event List for each step in your simulation table. . You can round up/down decimal numbers to closest in- teger number, i.e., you can consider 9 instead of 8.833. 2. (60 points) A small factory has two production lines (i.e., PL1 and PL2) and two repairmen (i.e., Repairman A and Repairman A). PL 1 and PL 2 start working at time 0. PL 1 may break down according to the distribution given below: Break down time of PL 1 Probability 10 hours 1/6 20 hours 3/6 30 hours 2/6 Also, PL 2 may break down according to the following distribution: Break down time of PL 2: Exponential distribution with pa- rameter 1 hours. If PL 1 breaks down, it should be serviced by Repairman A. The service time of Repairman A is as follows: Service time of Repairman A: Continuous uniform distribu- tion with parameters 6 and 12 hours. If PL 2 breaks down, it should be serviced by Repairman A with prob- ability 0.3 and it should be serviced by Repairman B with probability 0.7. The service time of Repairman B is as follows: Service time of Repairman B: 8 hours (constant). If PL 1 breaks down while Repairman A is busy on PL 2, then Re- pairman A should finish his service on PL 2 before servicing PL 1. Similarly, if PL 2 breaks down and it should be serviced by Repairman A while he is busy on PL 1, then Repairman A should finish his service on PL 1 before servicing PL 2. Use simulation table (manual simulation) to simulate the operation of the system for 50 hours in order to: (a) specify the first production line which breaks down in your simulation, (b) estimate the average idle time of Repairman B per hour, (c) estimate the average working time of PL 2 per hour, (d) estimate the average number of break downs of PL 2 per hour, IMPORTANT REMARKS: . Using Excel is NOT allowed, you should draw the table by hand. Show your work step-by-step and clearly. You can choose from the following list of random numbers whenever you need to use a random number: 0.122, 0.132, 0.234, 0.255, 0.261, 0.321, 0.347, 0.354, 0.398, 0.511, 0.512, 0.519, 0.645, 0.666, 0.683, 0.692. . You should show the calculation steps of each random quantity which you generate (e.g., break down time or service time). You should specify the used random num- ber and formula for generating each random quantity. Do not forget to include the Future Event List for each step in your simulation table. . You can round up/down decimal numbers to closest in- teger number, i.e., you can consider 9 instead of 8.833
Step by Step Solution
There are 3 Steps involved in it

Get step-by-step solutions from verified subject matter experts