

Question: 2 7 4 Part I The data shown below are in the form of quarterly rear-over-vear percentage changes for the US over the period 2018.1
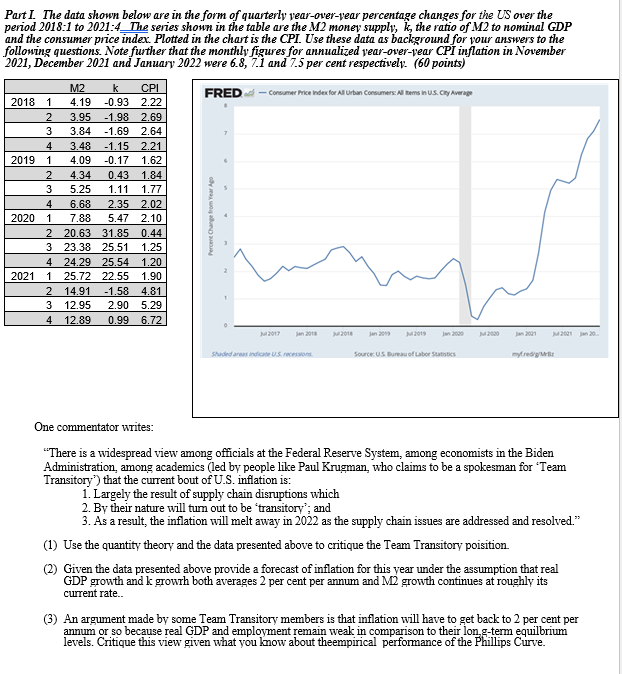
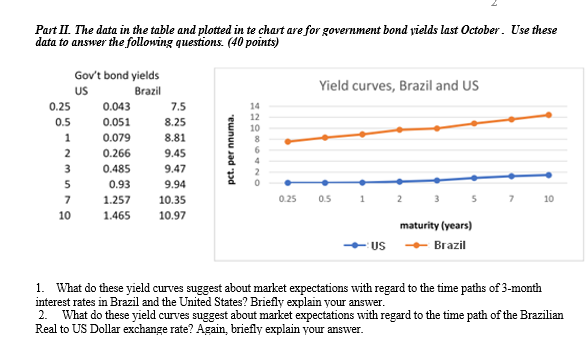
2 7 4 Part I The data shown below are in the form of quarterly rear-over-vear percentage changes for the US over the period 2018.1 to 2021:4_The series shown in the table are the M2 money supply, k, the ratio of M2 to nominal GDP and the consumer price index Plotted in the chat is the CPI. Use these data as background for your answers to the following questions. Note further that the monthly figures for annualized year-over-rear CPI inflation in November 2021, December 2021 and January 2022 were 6.8, 7.1 and 7.5 per cent respectively. (60 points) M2 k CPI FRED - Consumer Price Index for All Urban Consumers. Al terms in U.S. Cty Average 2018 1 4.19 -0.93 2.22 3.95 -1.98 2.69 3 3.84 -1.69 2.64 3.48 -1.15 2.21 2019 1 4.09 -0.17 1.62 2 4.34 0.43 1.84 3 5.25 1.11 1.77 6.68 2.35 2.02 2020 7.88 5.47 2.10 2 20.63 31.85 0.44 3 23.38 25.51 1.25 4 24.29 25.54 1.20 2021 1 25.72 22.55 1.90 2 14.91 -1.58 4.81 3 12.95 2.90 5.29 4 12.89 0.996.72 Jan 2009 4 1 2017 2018 M2021 20 Shaded as indice US. recen Source US Bureau of Labor Sess myfred One commentator writes: "There is a widespread view among officials at the Federal Reserve System, among economists in the Biden Administration among academics (led by people like Paul Krugman who claims to be a spokesman for 'Team Transitory) that the current bout of U.S. inflation is: 1. Largely the result of supply chain disruptions which 2. By their nature will turn out to be transitory'; and 3. As a result, the inflation will melt away in 2022 as the supply chain issues are addressed and resolved." (1) Use the quantity theory and the data presented above to critique the Team Transitory poisition (2) Given the data presented above provide a forecast of inflation for this year under the assumption that real GDP growth and k growth both averages 2 per cent per annum and M2 growth continues at roughly its current rate.. (3) An argument made by some Team Transitory members is that inflation will have to get back to 2 per cent per annum or so because real GDP and employment remain weak in comparison to their long-term equilbrium levels. Critique this view given what you know about theempirical performance of the Phillips Curve. Part II. The data in the table and plotted in te chart are for government bond vields last October. Use these data to answer the following questions. (40 points) Yield curves, Brazil and US Gov't bond yields US Brazil 0.25 0.043 7.5 0.5 0.051 8.25 1 0.079 8.81 2 0.266 9.45 3 0.485 9.47 5 0.93 9.94 7 1.257 10.35 10 1.465 10.97 pct. per nnuma. 14 12 10 8 6 0 0.25 0.5 1 2 3 5 7 10 maturity (years) Brazil US 1. What do these yield curves suggest about market expectations with regard to the time paths of 3- month interest rates in Brazil and the United States? Briefly explain your answer. What do these yield curves suggest about market expectations with regard to the time path of the Brazilian Real to US Dollar exchange rate? Again, briefly explain your answer. 2
Step by Step Solution
There are 3 Steps involved in it

Get step-by-step solutions from verified subject matter experts