

Question: 2 7 90% 4. [8 marks] The rush-hour traffic flow for a network of four one-way streets in Toronto is shown in the figure. The
![2 7 90% 4. [8 marks] The rush-hour traffic flow for](https://s3.amazonaws.com/si.experts.images/answers/2024/06/66682294c1141_62866682294a7001.jpg)
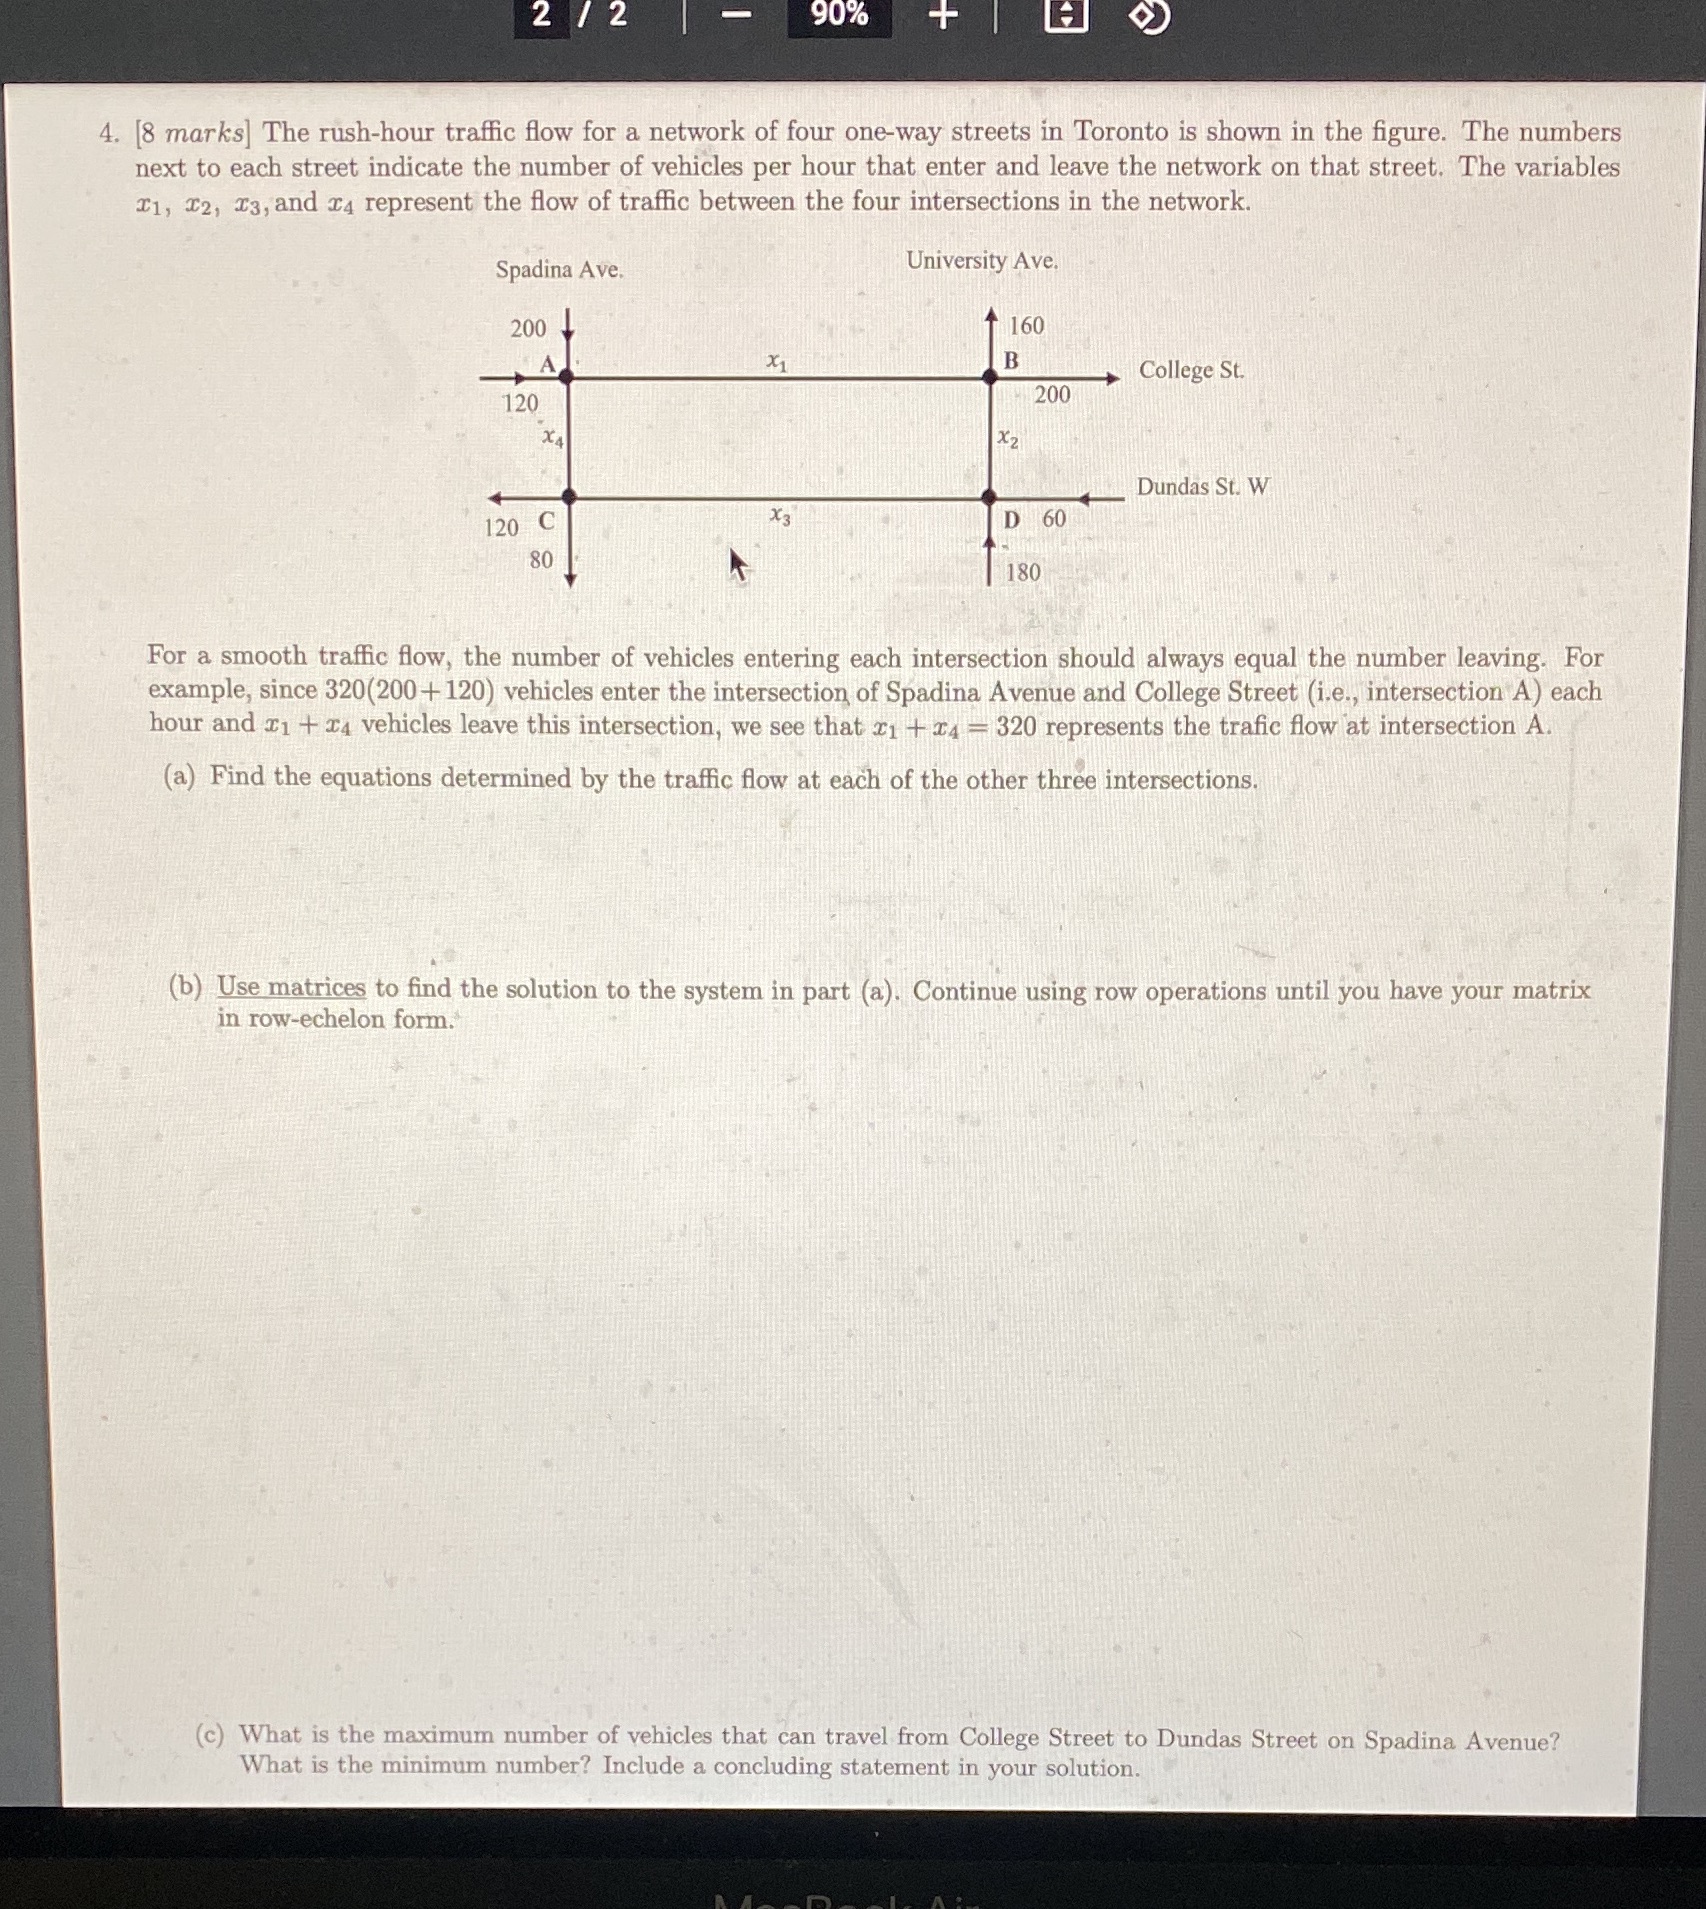
2 7 90% 4. [8 marks] The rush-hour traffic flow for a network of four one-way streets in Toronto is shown in the figure. The numbers next to each street indicate the number of vehicles per hour that enter and leave the network on that street. The variables T1, 12, 13, and r4 represent the flow of traffic between the four intersections in the network. Spadina Ave. University Ave. 200 160 B College St. 120 200 XA Dundas St. W 120 C D 60 80 180 For a smooth traffic flow, the number of vehicles entering each intersection should always equal the number leaving. For example, since 320(200 + 120) vehicles enter the intersection of Spadina Avenue and College Street (i.e., intersection A) each hour and r1 + 14 vehicles leave this intersection, we see that z1 + 24 - 320 represents the trafic flow at intersection A. (a) Find the equations determined by the traffic flow at each of the other three intersections. (b) Use matrices to find the solution to the system in part (a). Continue using row operations until you have your matrix in row-echelon form. (c) What is the maximum number of vehicles that can travel from College Street to Dundas Street on Spadina Avenue? What is the minimum number? Include a concluding statement in your solution
Step by Step Solution
There are 3 Steps involved in it

Get step-by-step solutions from verified subject matter experts