

Question: 2) (a) Based on the table below, calculate and interpret the Duncan Index to examine the degree of dissimilarity on the gender distributions across
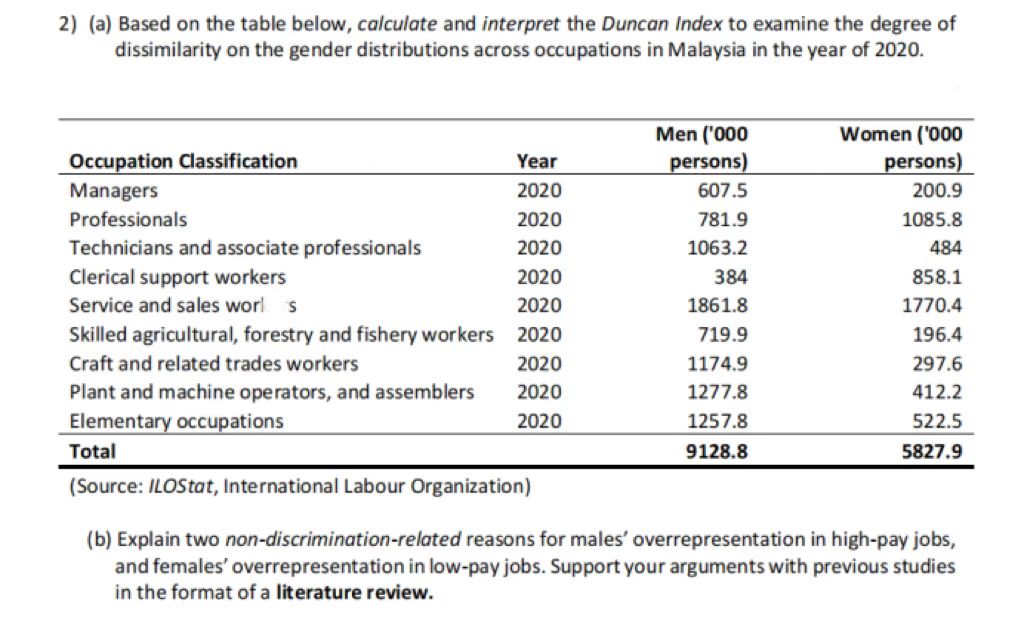
2) (a) Based on the table below, calculate and interpret the Duncan Index to examine the degree of dissimilarity on the gender distributions across occupations in Malaysia in the year of 2020. Men ('000 Occupation Classification Year persons) Women ('000 persons) Managers 2020 607.5 200.9 Professionals 2020 781.9 1085.8 Technicians and associate professionals 2020 1063.2 484 Clerical support workers 2020 384 858.1 Service and sales worl s 2020 1861.8 1770.4 Skilled agricultural, forestry and fishery workers 2020 719.9 196.4 Craft and related trades workers 2020 1174.9 297.6 Plant and machine operators, and assemblers 2020 Elementary occupations 1277.8 412.2 2020 1257.8 522.5 Total 9128.8 5827.9 (Source: ILOStat, International Labour Organization) (b) Explain two non-discrimination-related reasons for males' overrepresentation in high-pay jobs, and females' overrepresentation in low-pay jobs. Support your arguments with previous studies in the format of a literature review.
Step by Step Solution
There are 3 Steps involved in it

Get step-by-step solutions from verified subject matter experts