

Question: 2. A marketing analyst is studying the relationship between x = amount spent on television advertising and y = increase in sales. The data are
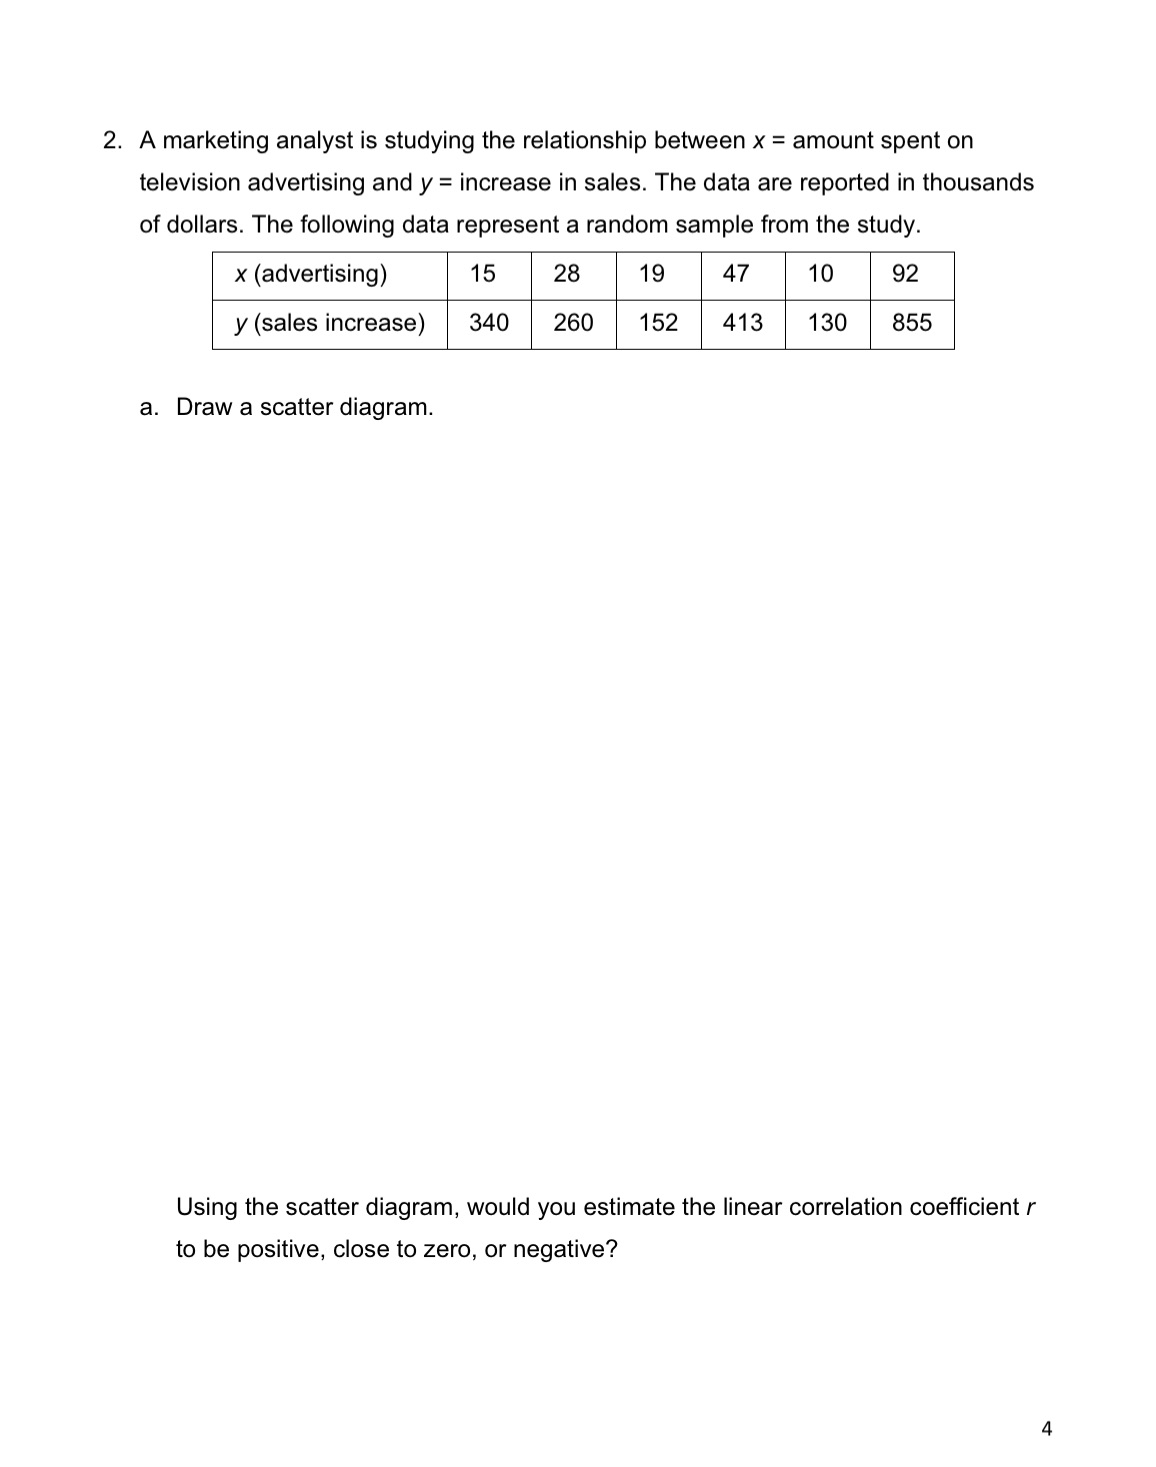
2. A marketing analyst is studying the relationship between x = amount spent on television advertising and y = increase in sales. The data are reported in thousands of dollars. The following data represent a random sample from the study. x (advertising) 15 28 19 47 10 92 y (sales increase) 340 260 152 413 130 855 a. Draw a scatter diagram. Using the scatter diagram, would you estimate the linear correlation coefficient r to be positive, close to zero, or negative? 4
Step by Step Solution
There are 3 Steps involved in it
1 Expert Approved Answer
Step: 1 Unlock

Question Has Been Solved by an Expert!
Get step-by-step solutions from verified subject matter experts
Step: 2 Unlock
Step: 3 Unlock