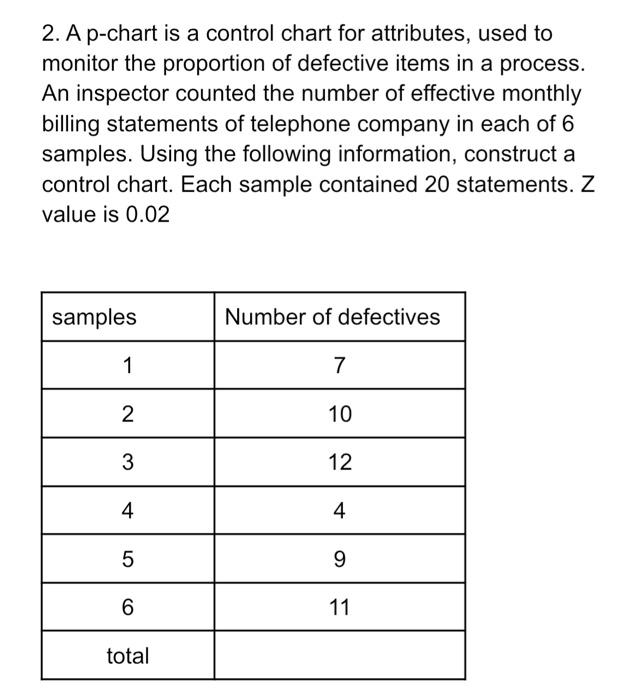
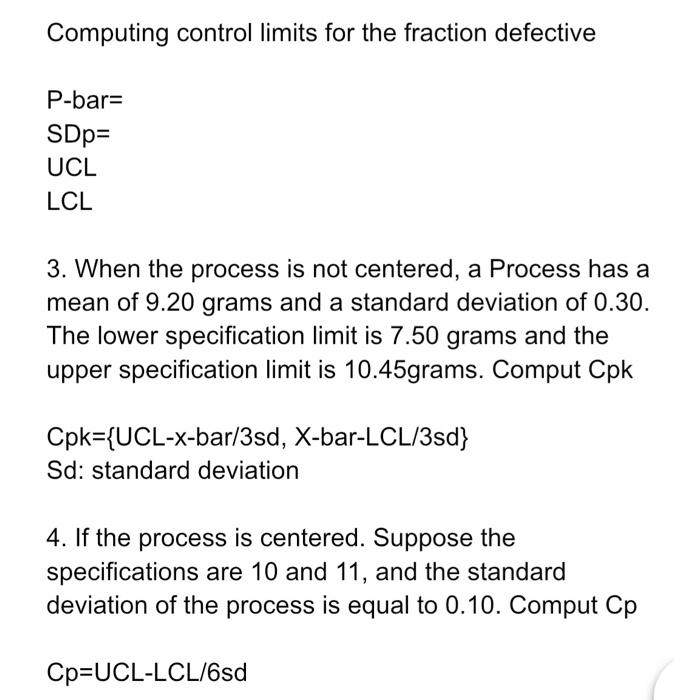
Question: 2. A p-chart is a control chart for attributes, used to monitor the proportion of defective items in a process. An inspector counted the number

2. A p-chart is a control chart for attributes,
2. A p-chart is a control chart for attributes, used to monitor the proportion of defective items in a process. An inspector counted the number of effective monthly billing statements of telephone company in each of 6 samples. Using the following information, construct a control chart. Each sample contained 20 statements. Z value is 0.02 samples Number of defectives 1 7 2 10 3 12 4 4 5 9 6 11 total Computing control limits for the fraction defective P-bar= = SDp= UCL LCL 3. When the process is not centered, a Process has a mean of 9.20 grams and a standard deviation of 0.30. The lower specification limit is 7.50 grams and the upper specification limit is 10.45grams. Comput Cpk Cpk={UCL-x-bar/3sd, X-bar-LCL/3sd} Sd: standard deviation 4. If the process is centered. Suppose the specifications are 10 and 11, and the standard deviation of the process is equal to 0.10. Comput Cp Cp=UCL-LCL/6sd

Step by Step Solution

There are 3 Steps involved in it

1 Expert Approved Answer
Step: 1 Unlock blur-text-image
Question Has Been Solved by an Expert!

Get step-by-step solutions from verified subject matter experts

Step: 2 Unlock
Step: 3 Unlock

Students Have Also Explored These Related General Management Questions!