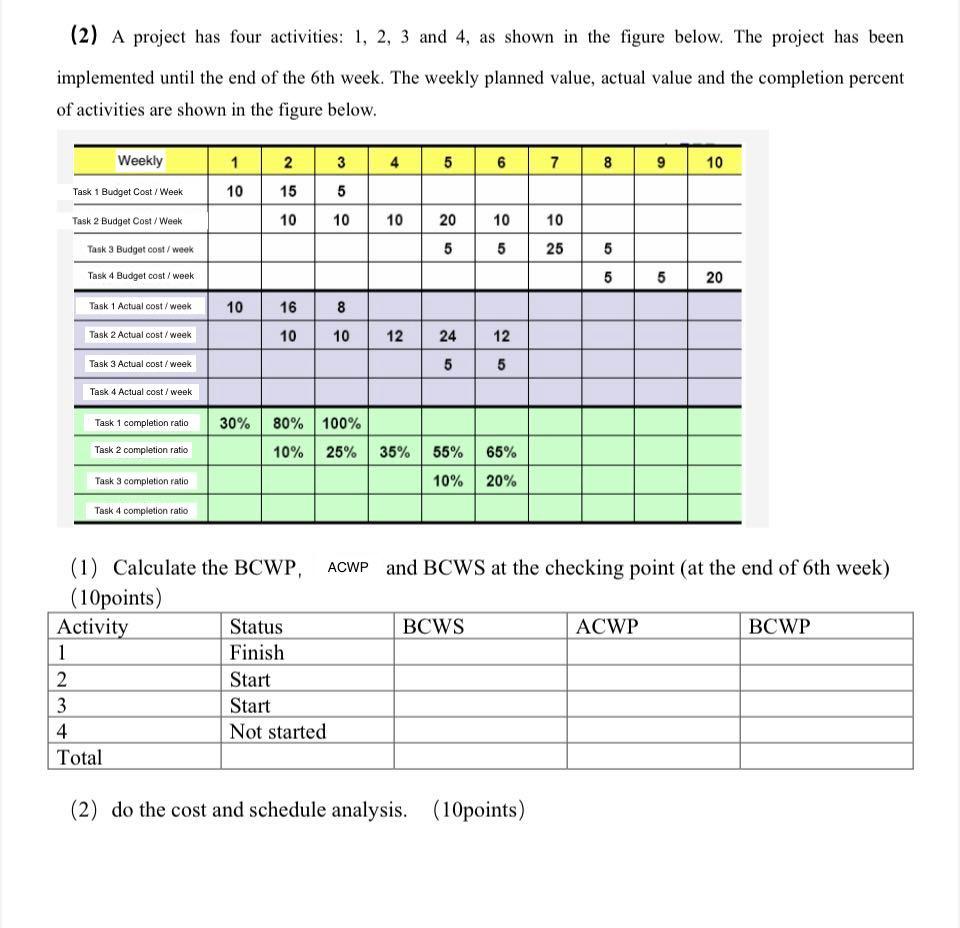
Question: (2) A project has four activities: 1, 2, 3 and 4, as shown in the figure below. The project has been implemented until the end

(2) A project has four activities: 1, 2, 3 and 4,

(2) A project has four activities: 1, 2, 3 and 4, as shown in the figure below. The project has been implemented until the end of the 6th week. The weekly planned value, actual value and the completion percent of activities are shown in the figure below. Weekly 1 2 3 4 5 6 7 8 9 10 Task 1 Budget Cost / Week 10 15 5 Task 2 Budget Cost / Week 10 10 10 20 10 10 Task 3 Budget cost/week 5 25 5 Task 4 Budget cost / week 5 20 Task 1 Actual cost / week 16 8 Task 2 Actual cost/week 10 10 12 12 Task 3 Actual cost / week 5 Task 4 Actual cost / week Task 1 completion ratio 30% 80% 100% Task 2 completion ratio 10% 25% 35% 55% 65% Task 3 completion ratio 10% 20% Task 4 completion ratio (1) Calculate the BCWP, ACWP and BCWS at the checking point (at the end of 6th week) (10points) Activity Status BCWS ACWP BCWP 1 Finish 2 Start 3 Start 4 Not started Total (2) do the cost and schedule analysis. (10points) 10 25 24 50 50

Step by Step Solution

There are 3 Steps involved in it

1 Expert Approved Answer
Step: 1 Unlock blur-text-image
Question Has Been Solved by an Expert!

Get step-by-step solutions from verified subject matter experts

Step: 2 Unlock
Step: 3 Unlock

Students Have Also Explored These Related General Management Questions!