

Question: 2. A regression analysis with recent U.N. data from several nations on Y : percentage of people who use the Internet, X1 2 per capita
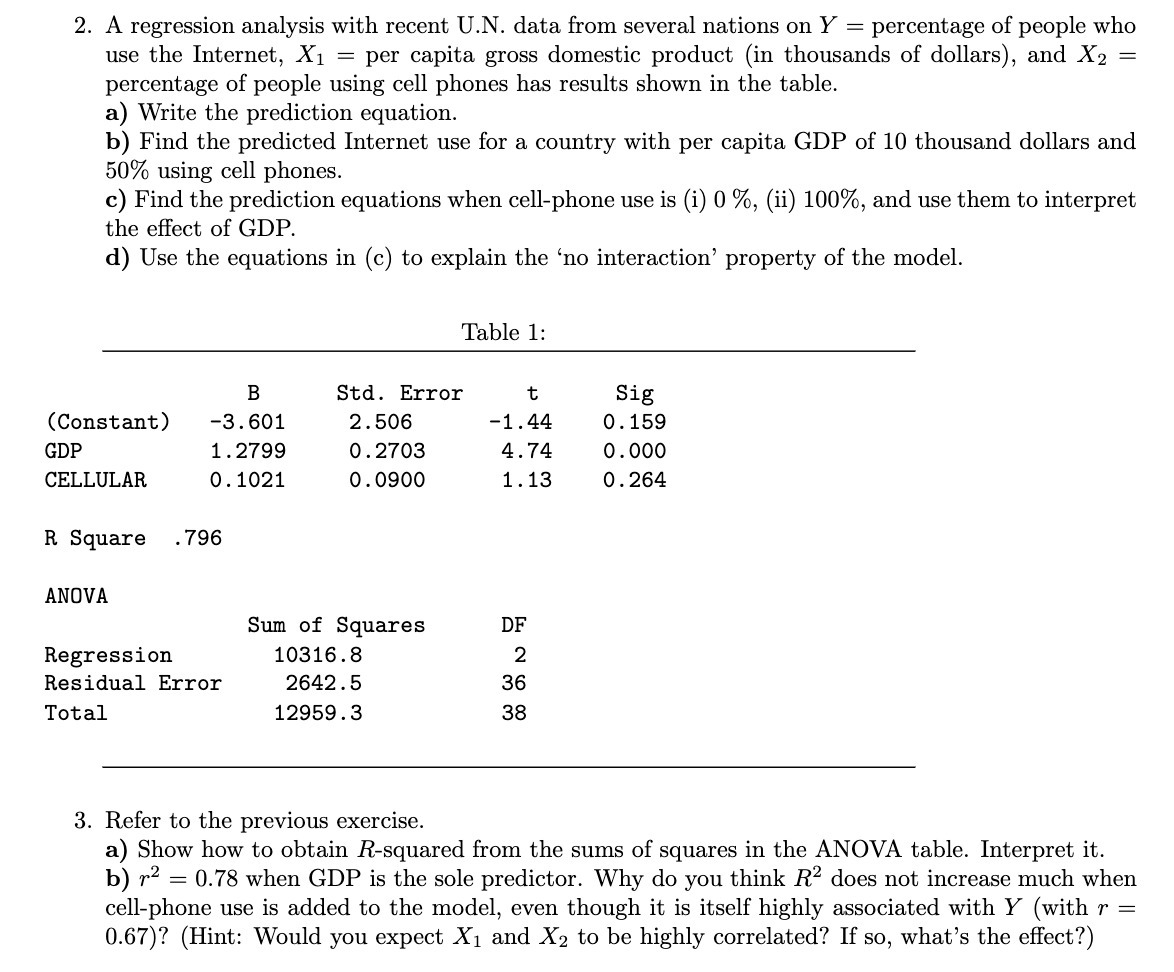

2. A regression analysis with recent U.N. data from several nations on Y : percentage of people who use the Internet, X1 2 per capita gross domestic product (in thousands of dollars), and X 2 2 percentage of people using cell phones has results shown in the table. a) Write the prediction equation. b) Find the predicted Internet use for a country with per capita GDP of 10 thousand dollars and 50% using cell phones. c) Find the prediction equations when cell-phone use is (i) 0 %, (ii) 100%, and use them to interpret the effect of GDP. d) Use the equations in (c) to explain the 'no interaction' property of the model. Tabhelz B Std. Error t Sig (Constant) -3.601 2.506 -1.44 0.159 GDP 1.2799 0.2703 4.74 0.000 CELLULAR 0.1021 0.0900 1.13 0.264 R Square .796 ANUVA Sum of Squares DF Regression 10316.8 2 Residual Error 2642.5 36 Total 12959.3 38 3. Refer to the previous exercise. a) Show how to obtain Rsquared from the sums of squares in the ANOVA table. Interpret it. b) r2 = 0.78 when GDP is the sole predictor. Why do you think R2 does not increase much when cell-phone use is added to the model, even though it is itself highly associated with Y (with r = 0.67)? (Hint: Would you expect X1 and X2 to be highly correlated? If so, what's the effect?)
Step by Step Solution
There are 3 Steps involved in it

Get step-by-step solutions from verified subject matter experts