

Question: 2. A study was recently done in which 500 people were asked to indicate their preferences for one of three products. The following table shows
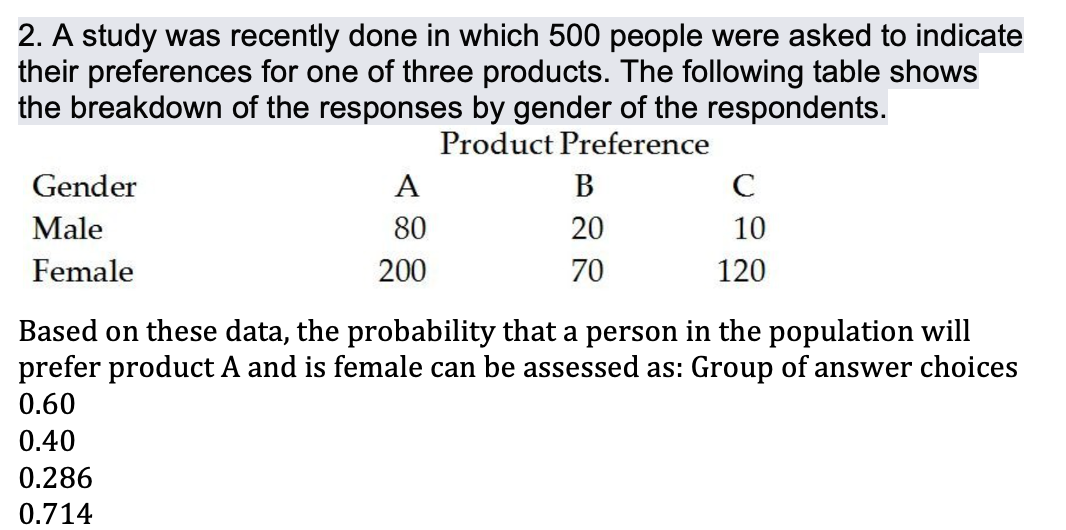
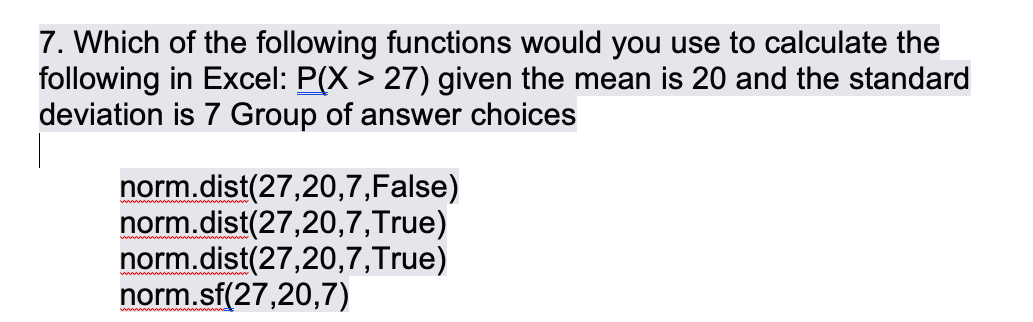
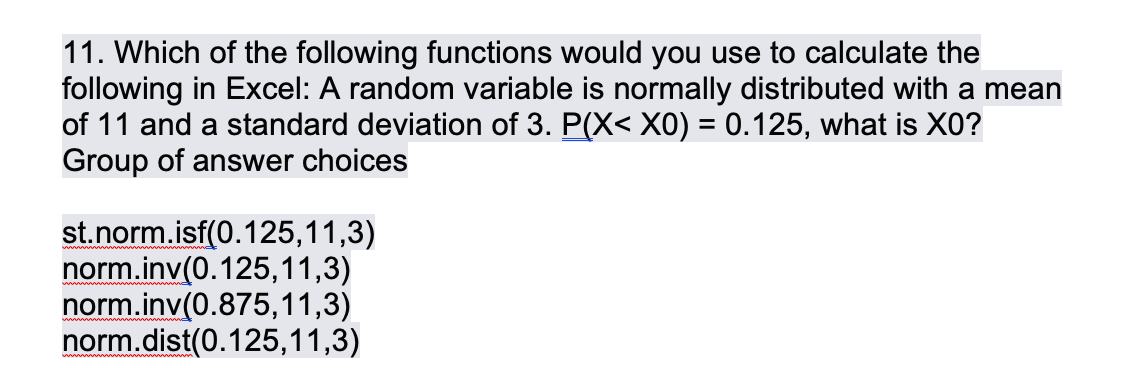
2. A study was recently done in which 500 people were asked to indicate their preferences for one of three products. The following table shows the breakdown of the responses by gender of the respondents. Product Preference Gender A B C Male 80 20 10 Female 200 70 120 Based on these data, the probability that a person in the population will prefer product A and is female can be assessed as: Group of answer choices 0.60 0.4-0 0.286 0.714 7. Which of the following functions would you use to calculate the following in Excel: :(X > 2?) given the mean is 20 and the standard ldeviation is 7 Group of answer choices norm.dist(27,20,7,False) norm.dist(27,20,7,True) norm.dist(27,20,7,True) norm.sf27,20,7) 11. Which of the following functions would you use to calculate the following in Excel: A random variable is normally distributed with a mean of 11 and a standard deviation of 3. gx
Step by Step Solution
There are 3 Steps involved in it

Get step-by-step solutions from verified subject matter experts