

Question: 2. A travel demand survey generates the data shown in Table 2.1. To obtain this data, 25 households (HH) are interviewed. The survey data includes
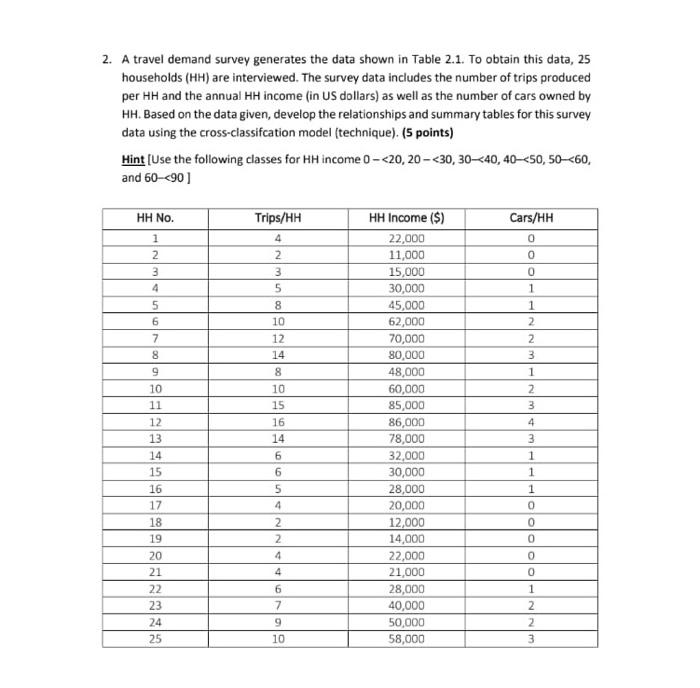
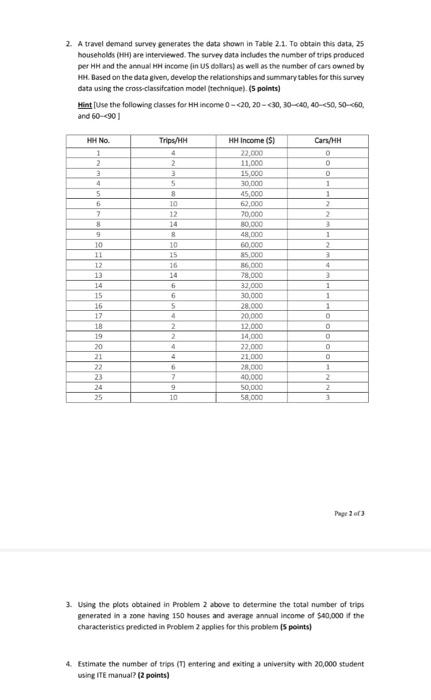
2. A travel demand survey generates the data shown in Table 2.1. To obtain this data, 25 households (HH) are interviewed. The survey data includes the number of trips produced per HH and the annual HH income (in US dollars) as well as the number of cars owned by HH. Based on the data given, develop the relationships and summary tables for this survey data using the cross-classifcation model (technique). (5 points) Hint (Use the following classes for HH income 0 -
Step by Step Solution
There are 3 Steps involved in it
1 Expert Approved Answer
Step: 1 Unlock

Question Has Been Solved by an Expert!
Get step-by-step solutions from verified subject matter experts
Step: 2 Unlock
Step: 3 Unlock