

Question: 2 a. What is the expected return and standard deviation of a portfolio composed of 20 percent of funds invested in stock D, 30 percent
2 a. What is the expected return and standard deviation of a portfolio composed of 20 percent of funds invested in stock D, 30 percent of funds in stock E, and 50 percent of funds in stock F?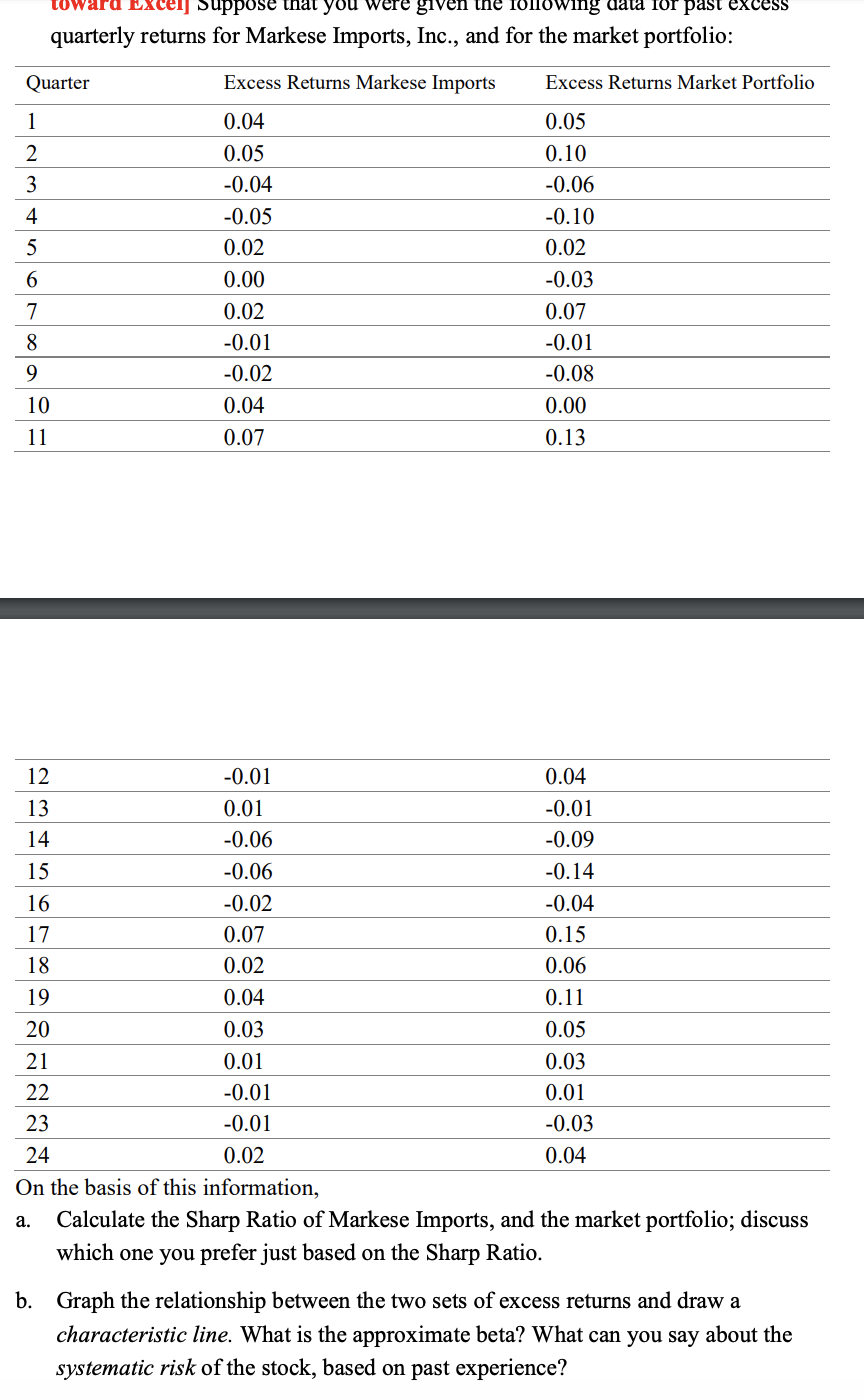
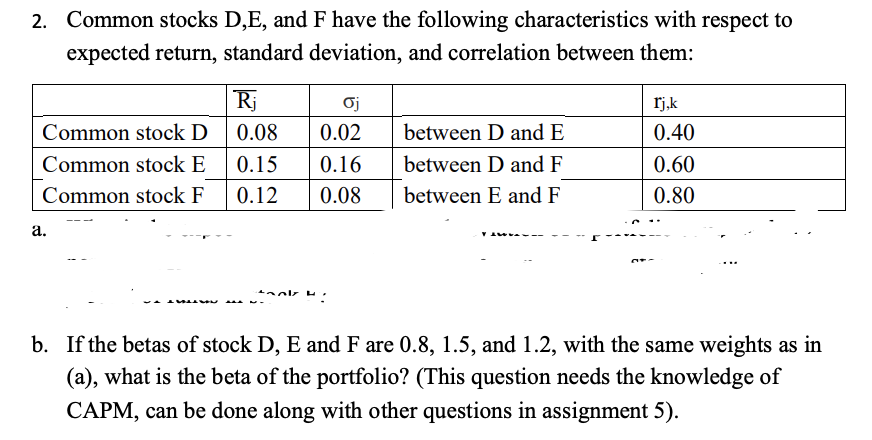
towaru Excel Suppose that you were given the 10110wing ward for past excess quarterly returns for Markese Imports, Inc., and for the market portfolio: Quarter 1 2 Excess Returns Markese Imports 0.04 0.05 -0.04 -0.05 0.02 0.00 0.02 -0.01 -0.02 0.04 0.07 Excess Returns Market Portfolio 0.05 0.10 -0.06 -0.10 0.02 -0.03 0.07 -0.01 -0.08 0.00 0.13 9 10 14 18 12 -0.01 0.04 13 0.01 -0.01 -0.06 -0.09 15 -0.06 -0.14 16 -0.02 -0.04 17 0.07 0.15 0.02 0.06 19 0.04 0.11 0.03 0.05 0.01 0.03 22 -0.01 0.01 23 -0.01 -0.03 24 0.02 0.04 On the basis of this information, a. Calculate the Sharp Ratio of Markese Imports, and the market portfolio, discuss which one you prefer just based on the Sharp Ratio. 20 21 b. Graph the relationship between the two sets of excess returns and draw a characteristic line. What is the approximate beta? What can you say about the systematic risk of the stock, based on past experience? 2. Common stocks D, E, and F have the following characteristics with respect to expected return, standard deviation, and correlation between them: Common stock D Common stock E Common stock F Ri 0.08 0.15 0.12 0.02 0.16 0.08 between D and E between D and F between E and F rjik 0.40 0.60 0.80 - ... b. If the betas of stock D, E and F are 0.8, 1.5, and 1.2, with the same weights as in (a), what is the beta of the portfolio? (This question needs the knowledge of CAPM, can be done along with other questions in assignment 5). towaru Excel Suppose that you were given the 10110wing ward for past excess quarterly returns for Markese Imports, Inc., and for the market portfolio: Quarter 1 2 Excess Returns Markese Imports 0.04 0.05 -0.04 -0.05 0.02 0.00 0.02 -0.01 -0.02 0.04 0.07 Excess Returns Market Portfolio 0.05 0.10 -0.06 -0.10 0.02 -0.03 0.07 -0.01 -0.08 0.00 0.13 9 10 14 18 12 -0.01 0.04 13 0.01 -0.01 -0.06 -0.09 15 -0.06 -0.14 16 -0.02 -0.04 17 0.07 0.15 0.02 0.06 19 0.04 0.11 0.03 0.05 0.01 0.03 22 -0.01 0.01 23 -0.01 -0.03 24 0.02 0.04 On the basis of this information, a. Calculate the Sharp Ratio of Markese Imports, and the market portfolio, discuss which one you prefer just based on the Sharp Ratio. 20 21 b. Graph the relationship between the two sets of excess returns and draw a characteristic line. What is the approximate beta? What can you say about the systematic risk of the stock, based on past experience? 2. Common stocks D, E, and F have the following characteristics with respect to expected return, standard deviation, and correlation between them: Common stock D Common stock E Common stock F Ri 0.08 0.15 0.12 0.02 0.16 0.08 between D and E between D and F between E and F rjik 0.40 0.60 0.80 - ... b. If the betas of stock D, E and F are 0.8, 1.5, and 1.2, with the same weights as in (a), what is the beta of the portfolio? (This question needs the knowledge of CAPM, can be done along with other questions in assignment 5)
Step by Step Solution
There are 3 Steps involved in it

Get step-by-step solutions from verified subject matter experts