

Question: 2. An introduction to analysis of variance Do prep classes effectively lncrease SAT scores? The following study cited in a major newspaper claims that they
![that they do (but not by a substantial amount]: \"A new study...](https://dsd5zvtm8ll6.cloudfront.net/si.experts.images/questions/2024/10/671cf62c6cd10_276671cf62c49a00.jpg)
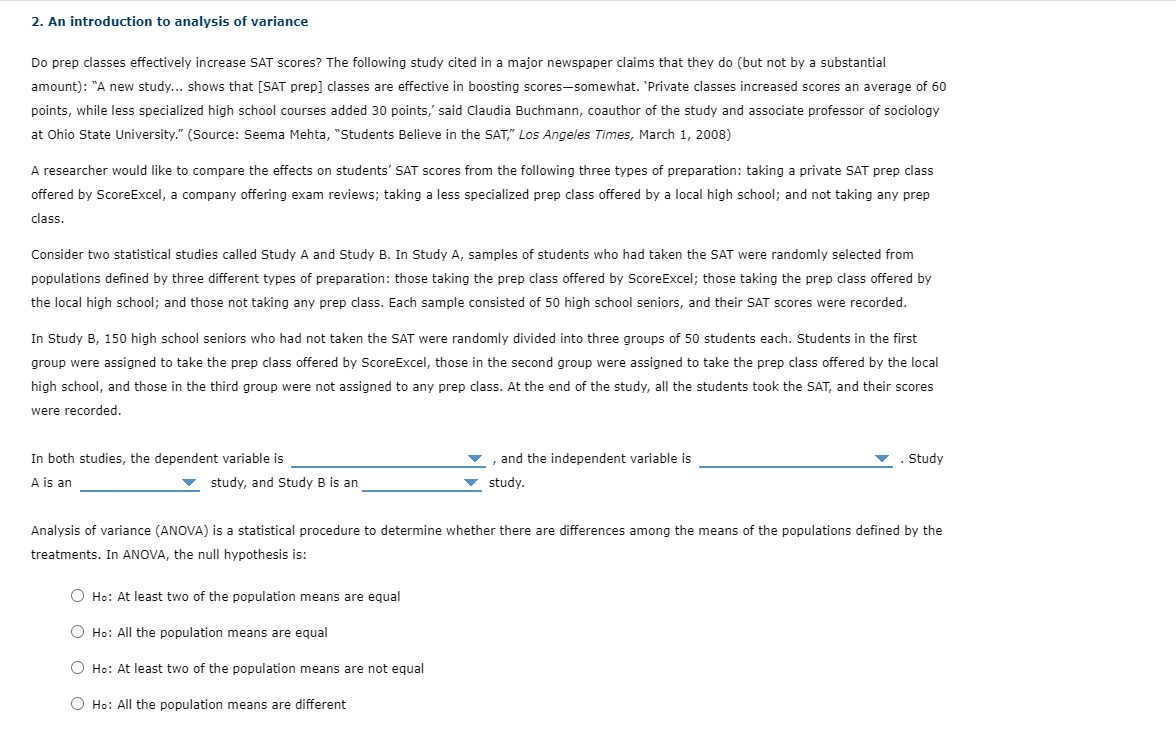
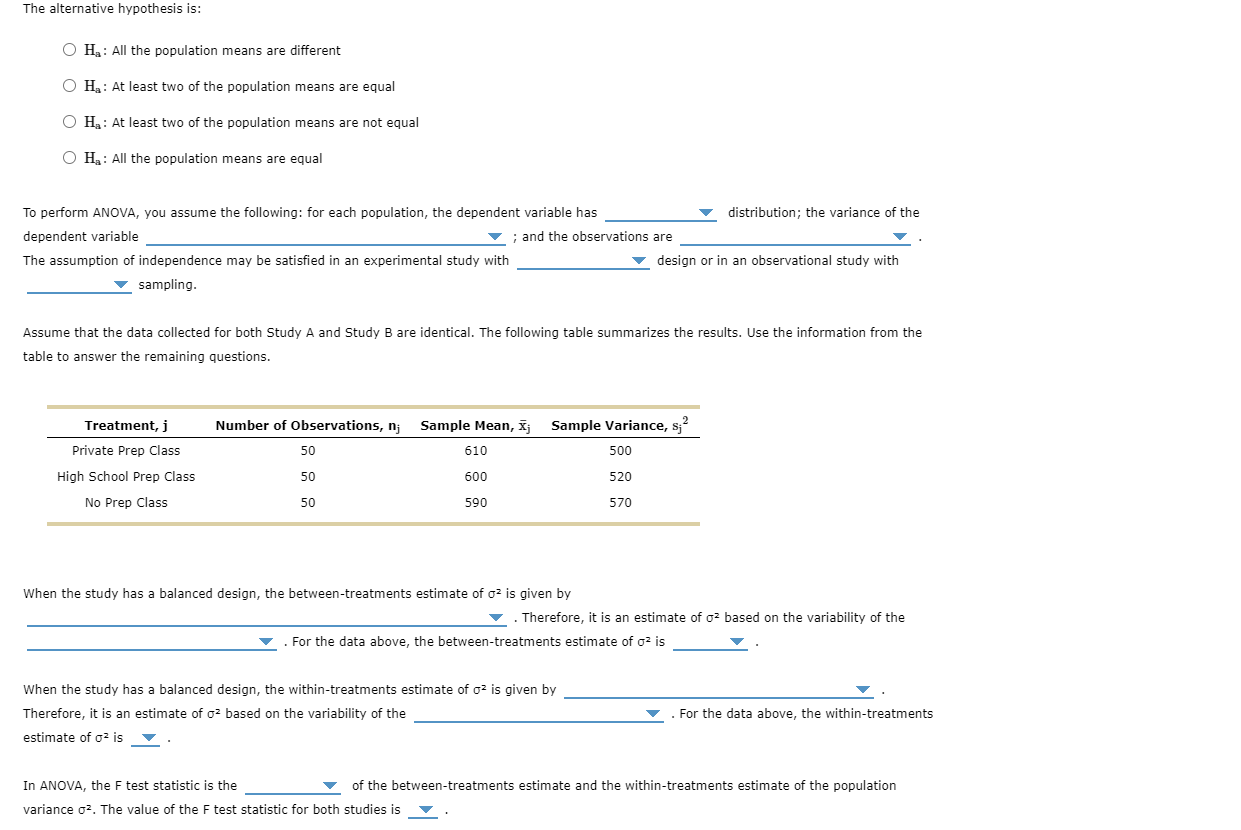
2. An introduction to analysis of variance Do prep classes effectively lncrease SAT scores? The following study cited in a major newspaper claims that they do (but not by a substantial amount]: \"A new study... shows that [SAT prep] classes are effective in boosting scoressomewhat. 'Private classes increased scores an average of 60 points, while less specialized high school courses added 30 points,' said Claudia Buchmann, coauthor of the study and associate professor of sociology at Ohio State University." (Source: Seema Mehta, \"Students Believe in the SAT,\" L05 Angela's Times, March 1, 2008] A researcher would like to compare the effects on students' SAT scores from the following three types of preparation: taking a private SAT prep class offered by ScoreExcel, a company offering exam reviews; taking a less specialized prep class offered by a local high school; and not taking any prep class. Consider two statistical studies called Study A and Study B. In Study A, samples of students who had taken the SAT were randomly selected from populations dened by three different types of preparation: those taking the prep class offered by ScoreExcel; those taking the prep class offered by the local high school; and those not taking any prep class. Each sample consisted of 50 high school seniors, and their SAT scores were recorded. In Study B, 150 high school seniors who had not taken the SAT were randomly divided into three groups of 50 students each. Students in the first group were assigned to take the prep class offered by ScoreExcel, those in the second group were assigned to take the prep class offered by the local high school, and those in the third group were not assigned to any prep class. At the end of the study, all the students took the SAT, and their scores were recorded. In both studies, the dependent variable is V , and the independent variable is V . Study A is an V studyr and Study B is an V study. Analysis of variance {ANOVA} is a statistical procedure to determine whether there are differences among the means of the populations dened by the treatments. In ANOVA, the null hypothesis is: 0 Ho: At least two of the population means are equal 0 Ho: All the population means are equal 0 Ho: At least two of the population means are not equal 0 Ho: All the population means are different The alternative hypothesis is: 0 Ha: All the population means are different 0 Ha: At least two of the population means are equai 0 Ha: At least two of the population means are not equal 0 Ha: All the population means are equal To perform ANOVA, you assume the following: for each population, the dependent variable has V distribution; the variance of the dependent variable V : and the observations are V . The assumption of independence may be satised in an experimental study with V design or in an observational study with V sampiing. Assume that the data coilected for both Study A and Study B are identical. The following table summarizes the resuits. Use the information from the table to answer the remaining questions. Treatment, j Number of Observations, nj Sample Mean, i,- Sample Variance, 532 Private Prep Class 50 610 500 High School Prep Class 50 600 520 No Prep Class 50 590 570 When the study has a balanced design, the between-treatments estimate of o2 is given by V . Therefore, it is an estimate of 02 based on the variability of the V . For the data above, the betweentreatments estimate of 02 is V . When the study has a balanced design, the within-treatments estimate of 62 is given by V . Therefore, it is an estimate of oz based on the variability of the V . For the data above, the withintreatments estimate of 0'1 is V In ANOVA, the F test statistic is the V of the between-treatments estimate and the withintreatments estimate of the population variance 0:. The value of the F test statistic for both studies is V The assumption of independence may be satised in an experimental study with V design or in an observational study with V sampling. Assume that the data collected for both Study A and Study B are identical. The following table summarizes the results. Use the infonTIation from the table to answer the remaining questions. Treatment, j Number of Observations, rIJ Sample Mean. 5.] Sample Variance, 5? Private Prep Class 50 610 500 High School Prep Class 50 600 520 No Prep Class 50 590 570 when the study has a balanced design, the between-treatments estimate of o2 is given by V . Therefore, it is an estimate of 07 based on the variability of the . For the data above, the betweenitreatments estimate of o2 is V . when the study has a balanced design, the within-treatments estimate of o'2 is given by V . Therefore, it is an estimate of oz based on the variability of the V . For the data abover the withintreatments estimate of o'- is V In ANOVA, the F test statistic is the V of the between-treatments estimate and the within-treatments estimate of the population variance oz. The value of the F test statistic for both studies is V when the null hypothesis is true, both the betweentreatments and within-treatments estimates of 01 V the population variance. when the null hypothesis is false, the between-treatments estimate of 0'2 V , while the within-treatments estimate of 02 V , when the null hypothesis is true, the F test statistic is V . When the null hypothesis is false, the F test statistic is most likely V . Hence, you should reject the null hypothesis for V . In Study A, rejection of the null hypothesis V a cause-andeffect relationship between type of preparation and SAT scores. In Study B, rejection of the null hypothesis V a causeand-effect relationship between type of preparation and SAT scores
Step by Step Solution
There are 3 Steps involved in it

Get step-by-step solutions from verified subject matter experts