

Question: 2 and 3 only please 2. From the velocity-time graph in Figure 9, generate Position v. Time for Accelerated Motion position-time data and then plot
2 and 3 only please
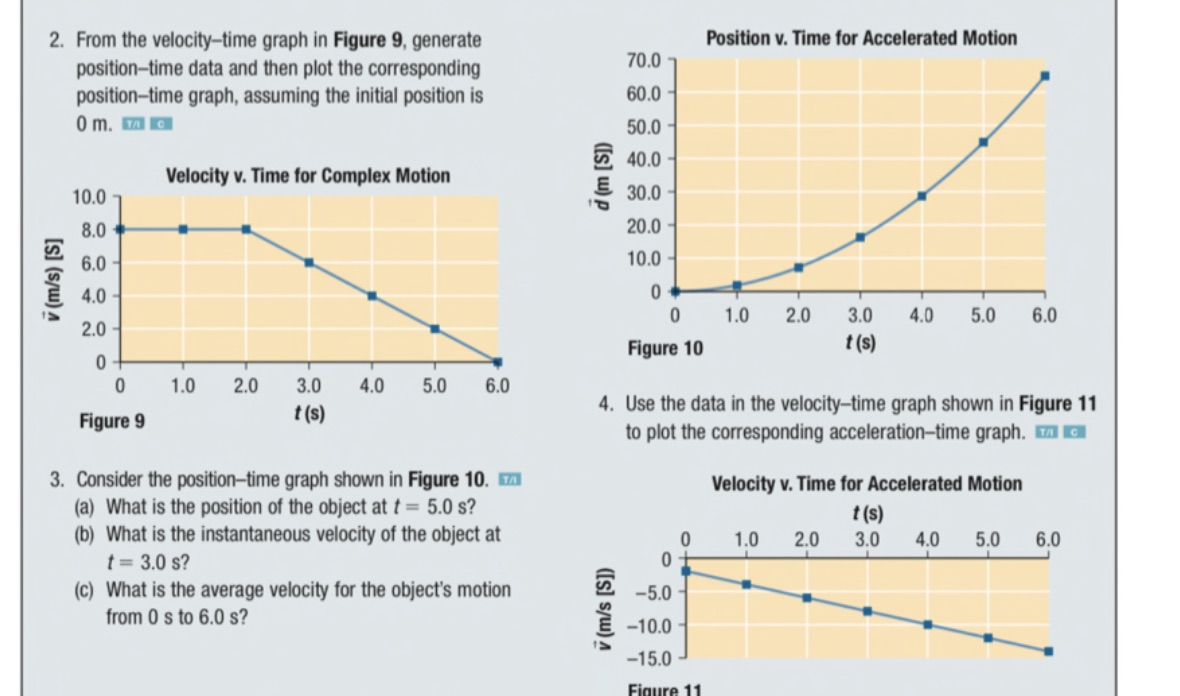
2. From the velocity-time graph in Figure 9, generate Position v. Time for Accelerated Motion position-time data and then plot the corresponding 70.0 position-time graph, assuming the initial position is 60.0 0 m. T C 50.0 40.0 Velocity v. Time for Complex Motion d (m [SD) 10.0 30.0 8.0 20.0 6.0 10.0 v (m/s) [S] 4.0 0 1.0 2.0 3.0 4.0 5.0 6.0 2.0- Figure 10 t (s) 0+ 0 1.0 2.0 3.0 4.0 5.0 6.0 4. Use the data in the velocity-time graph shown in Figure 11 Figure 9 t(s) to plot the corresponding acceleration-time graph. Tic 3. Consider the position-time graph shown in Figure 10. mm Velocity v. Time for Accelerated Motion (a) What is the position of the object at t = 5.0 s? t(s) (b) What is the instantaneous velocity of the object at 1.0 2.0 3.0 4.0 5.0 6.0 t = 3.0 s? 0 (c) What is the average velocity for the object's motion -5.0 from 0 s to 6.0 s? v (m/s [S]) -10.0 -15.0 Figure 11
Step by Step Solution
There are 3 Steps involved in it

Get step-by-step solutions from verified subject matter experts