

Question: 2 and represent variance and standard deviation population parameters, while s2 and s represent sample statistics. Sample Variance and Standard Deviation For a sample with
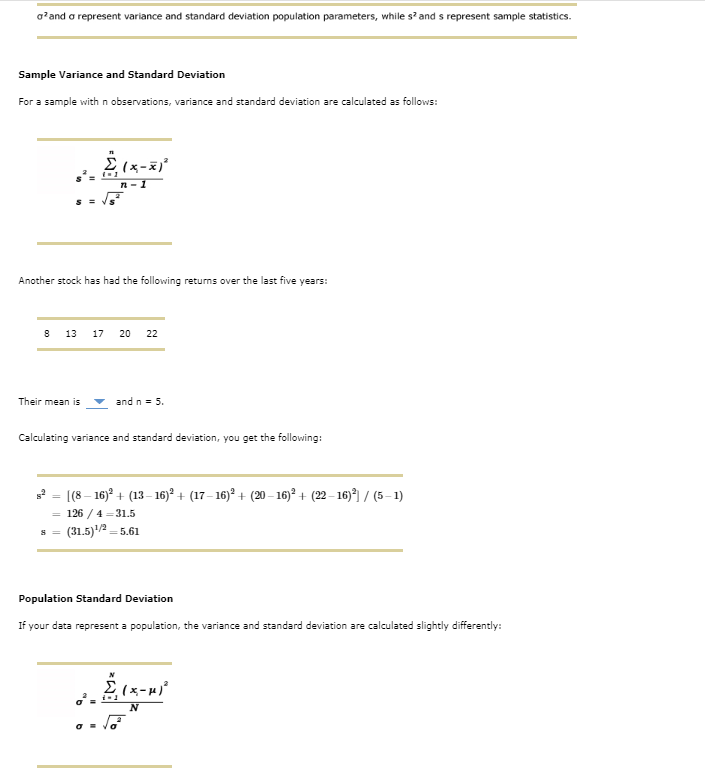
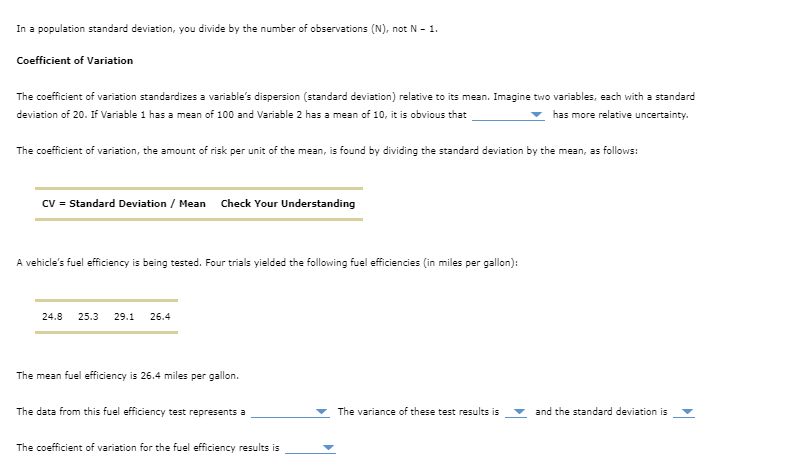
2 and represent variance and standard deviation population parameters, while s2 and s represent sample statistics. Sample Variance and Standard Deviation For a sample with n observations, variance and standard deviation are calculated as follows: s2=n1i=1n(x1x)2s=s2 Another stock has had the following returns over the last five years: Their mean is and n=5. Calculating variance and standard deviation, you get the following: s2s=[(816)2+(1316)2+(1716)2+(2016)2+(2216)2]/(51)=126/4=31.5=(31.5)1/2=5.61 Population Standard Deviation If your data represent a population, the variance and standard deviation are calculated slightly differently: 2=Ni=1N(xi)2=2N In a population standard deviation, you divide by the number of observations (N), not N1, Coefficient of Variation The coefficient of variation standardizes a variable's dispersion (standard deviation) relative to its mean. Imagine two variables, each with a standard deviation of 20 . If Variable 1 has a mean of 100 and Variable 2 has a mean of 10 , it is obvious that has more relative uncertainty. The coefficient of variation, the amount of risk per unit of the mean, is found by dividing the standard deviation by the mean, as follows: A vehicle's fuel efficiency is being tested. Four trials yielded the following fuel efficiencies (in miles per gallon): The mean fuel efficiency is 26.4 miles per gallon. The data from this fuel efficiency test represents a The variance of these test results is and the standard deviation i The coefficient of variation for the fuel efficiency results is 2 and represent variance and standard deviation population parameters, while s2 and s represent sample statistics. Sample Variance and Standard Deviation For a sample with n observations, variance and standard deviation are calculated as follows: s2=n1i=1n(x1x)2s=s2 Another stock has had the following returns over the last five years: Their mean is and n=5. Calculating variance and standard deviation, you get the following: s2s=[(816)2+(1316)2+(1716)2+(2016)2+(2216)2]/(51)=126/4=31.5=(31.5)1/2=5.61 Population Standard Deviation If your data represent a population, the variance and standard deviation are calculated slightly differently: 2=Ni=1N(xi)2=2N In a population standard deviation, you divide by the number of observations (N), not N1, Coefficient of Variation The coefficient of variation standardizes a variable's dispersion (standard deviation) relative to its mean. Imagine two variables, each with a standard deviation of 20 . If Variable 1 has a mean of 100 and Variable 2 has a mean of 10 , it is obvious that has more relative uncertainty. The coefficient of variation, the amount of risk per unit of the mean, is found by dividing the standard deviation by the mean, as follows: A vehicle's fuel efficiency is being tested. Four trials yielded the following fuel efficiencies (in miles per gallon): The mean fuel efficiency is 26.4 miles per gallon. The data from this fuel efficiency test represents a The variance of these test results is and the standard deviation i The coefficient of variation for the fuel efficiency results is
Step by Step Solution
There are 3 Steps involved in it

Get step-by-step solutions from verified subject matter experts