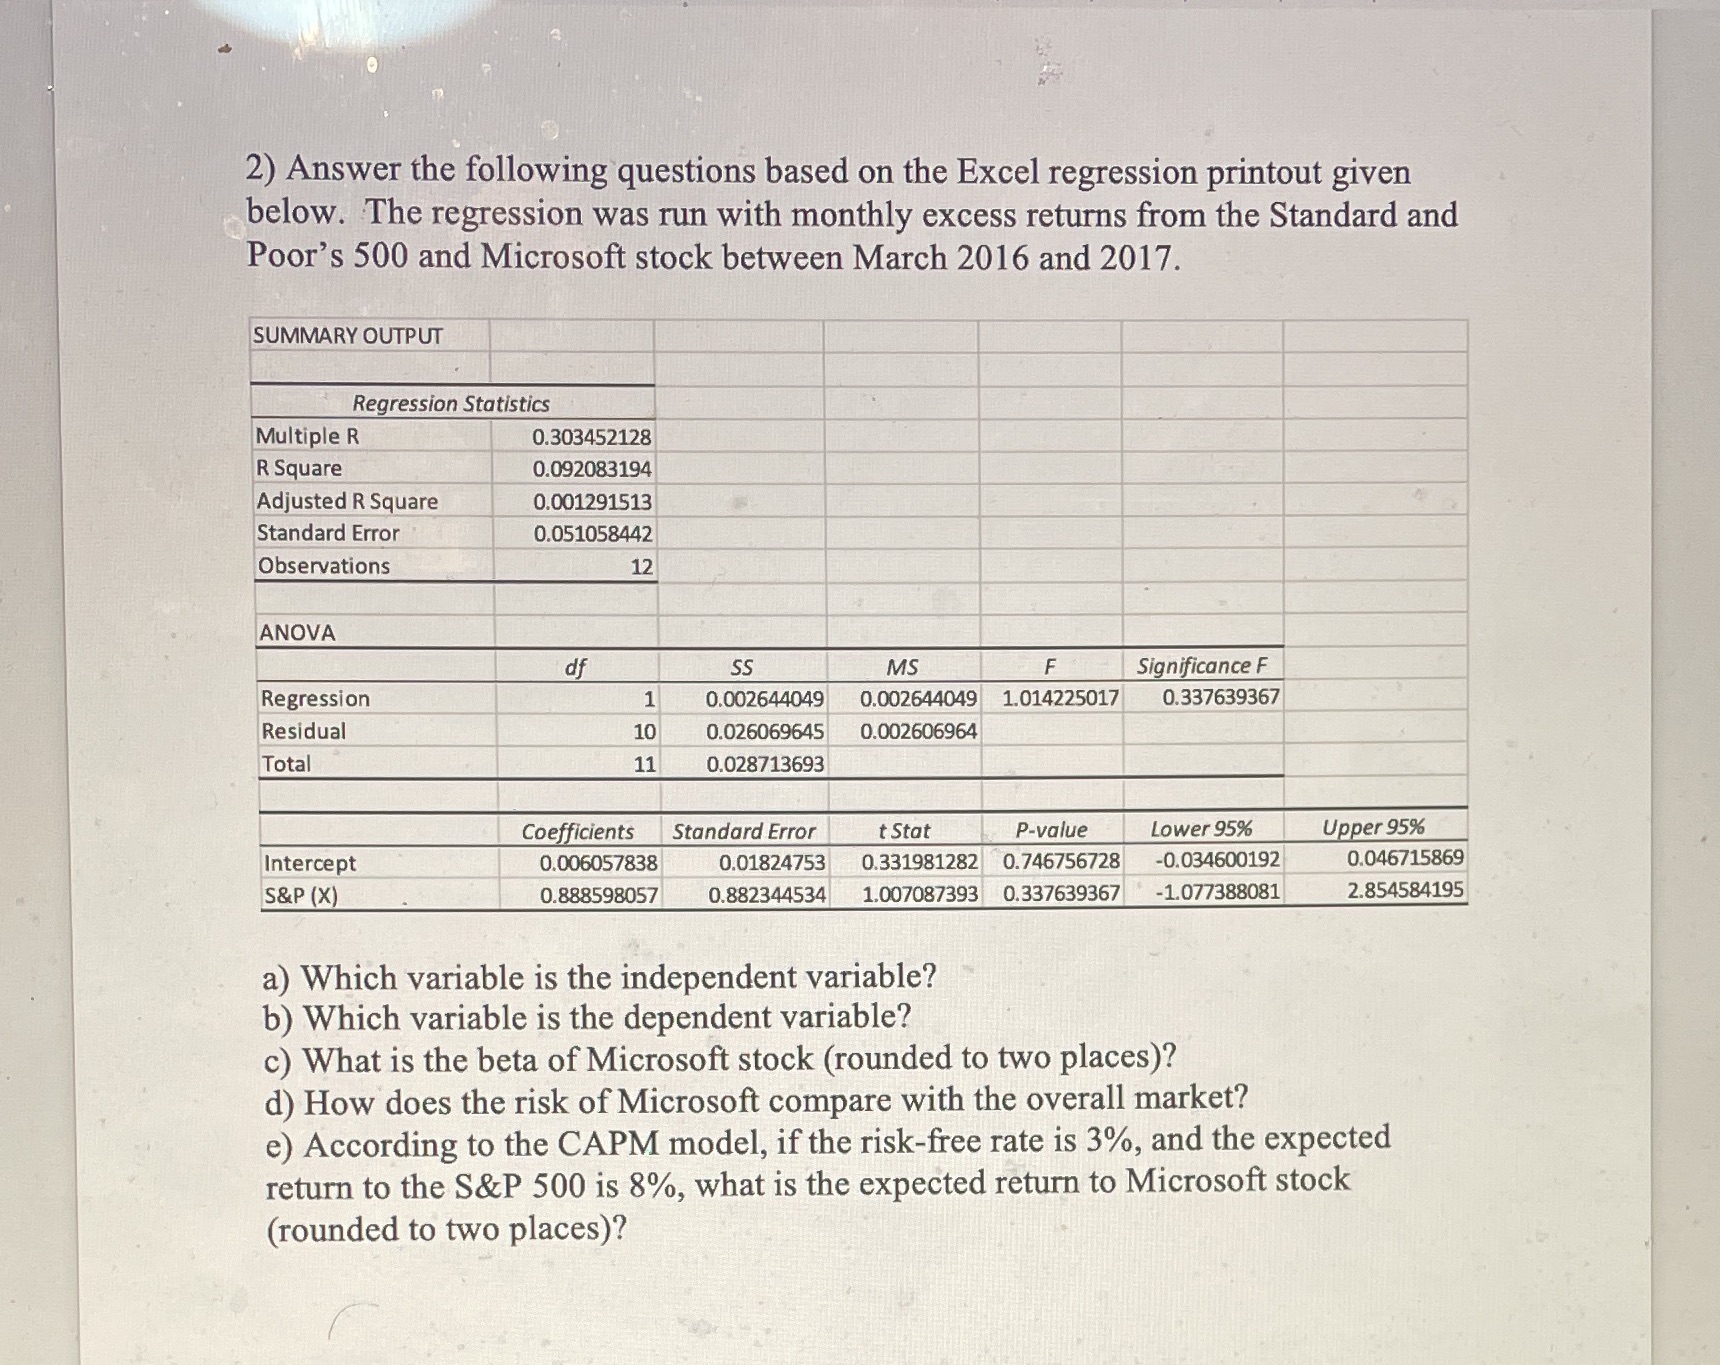
Question: 2) Answer the following questions based on the Excel regression printout given below. The regression was run with monthly excess returns from the Standard and

2) Answer the following questions based on the
2) Answer the following questions based on the Excel regression printout given below. The regression was run with monthly excess returns from the Standard and Poor's 500 and Microsoft stock between March 2016 and 2017. SUMMARY OUTPUT Regression Statistics Multiple R 0.303452128 R Square 0.092083194 Adjusted R Square 0.001291513 Standard Error 0.051058442 Observations 12 ANOVA df SS MS F Significance F Regression 1 0.002644049 0.002644049 1.014225017 0.337639367 Residual 10 0.026069645 0.002606964 Total 11 0.028713693 Coefficients Standard Error t Sta P-value Lower 95% Upper 95% Intercept 0.006057838 0.01824753 0.331981282 0.746756728 -0.034600192 0.046715869 S&P (X) 0.888598057 0.882344534 1.007087393 0.337639367 -1.077388081 2.854584195 a) Which variable is the independent variable? b) Which variable is the dependent variable? c) What is the beta of Microsoft stock (rounded to two places)? d) How does the risk of Microsoft compare with the overall market? e) According to the CAPM model, if the risk-free rate is 3%, and the expected return to the S&P 500 is 8%, what is the expected return to Microsoft stock (rounded to two places)

Step by Step Solution

There are 3 Steps involved in it

1 Expert Approved Answer
Step: 1 Unlock blur-text-image
Question Has Been Solved by an Expert!

Get step-by-step solutions from verified subject matter experts

Step: 2 Unlock
Step: 3 Unlock

Students Have Also Explored These Related Finance Questions!